Correlation Between S&P 500 and U.S. Treasuries
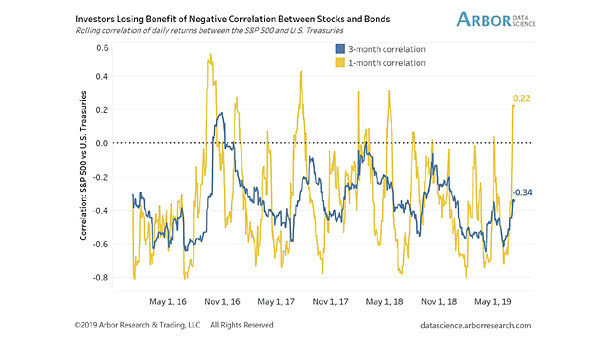
Correlation Between S&P 500 and U.S. Treasuries This chart shows the correlation between stocks and bonds, which could affect a balanced 60/40 portfolio. Image: Arbor Research & Trading LLC
Correlation Between S&P 500 and U.S. Treasuries This chart shows the correlation between stocks and bonds, which could affect a balanced 60/40 portfolio. Image: Arbor Research & Trading LLC
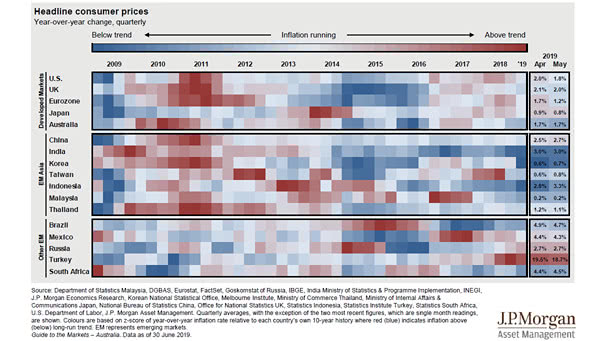
Global Inflation Interesting chart showing that inflation is largely a global phenomenon. Picture Source: J.P. Morgan Asset Management
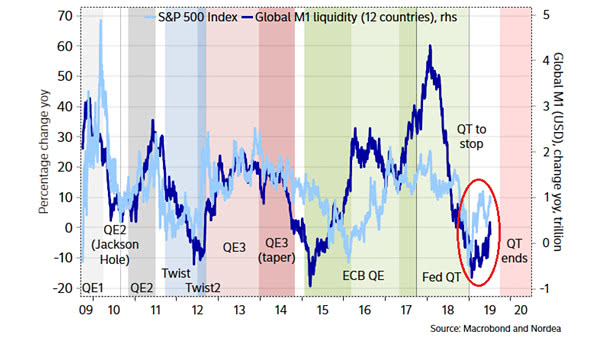
S&P 500 Index vs. Global M1 Liquidity Another good correlation between the S&P 500 Index and global M1 liquidity, while the Fed plans to stop quantitative tightening. The money supply M1 is the amount of effective money in the economy. Image: Nordea and Macrobond
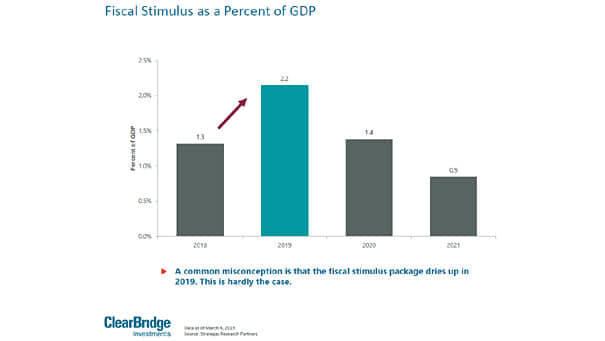
U.S. Fiscal Stimulus as a Percent of GDP The chart shows the impact of the Trump fiscal stimulus on U.S. economic growth until 2021. You may also like “Despite Full Employment, Why Real GDP Should Stay Above Potential GDP?“ Image: ClearBridge Investments
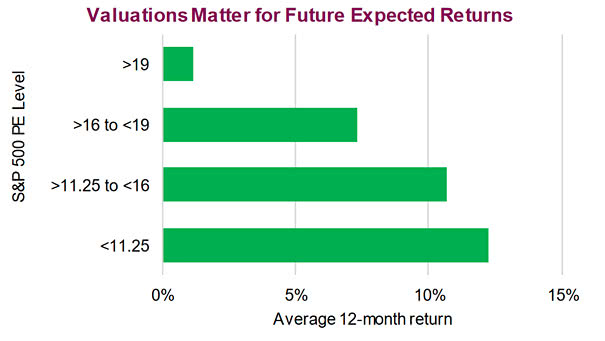
S&P 500 PE Level vs. Average 12-month Return The chart shows how market valuation affects future equity returns since 1930. You may also like “Why the Stock Market Valuation Matters Before a Recession?“ Image: Richardson Wealth
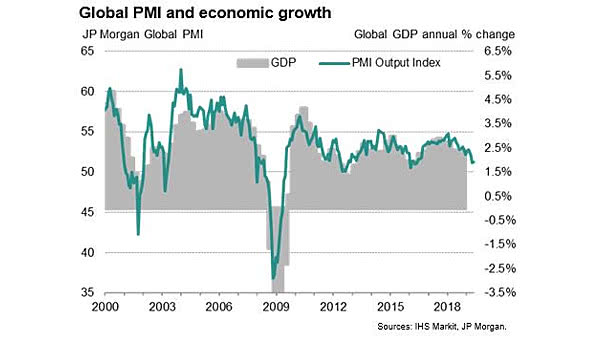
Global PMI vs. Global GDP The chart shows the strong correlation between global PMI and global GDP. Global PMI slides to lowest since 2016 and global GDP may have difficulty growing at a rate above 2% in the near future. Image: IHS Markit
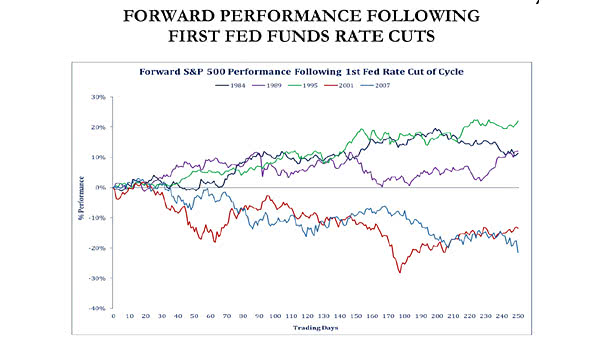
Forward Performance Following First Fed Funds Rate Cuts After first Fed rate cut, the S&P 500 performance is quite attractive on average when no recession. You may also like “Dow Jones Industrial Average Around First Fed Rate Cut.” Image: Strategas
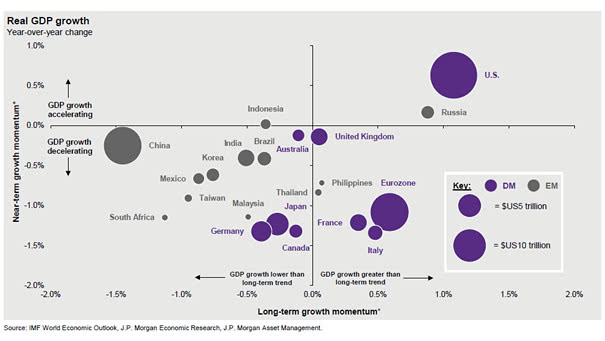
Global Growth Economy This chart shows the global real GDP growth and the long-term growth momentum. It’s never paid to bet against America. Picture Source: J.P. Morgan Asset Management
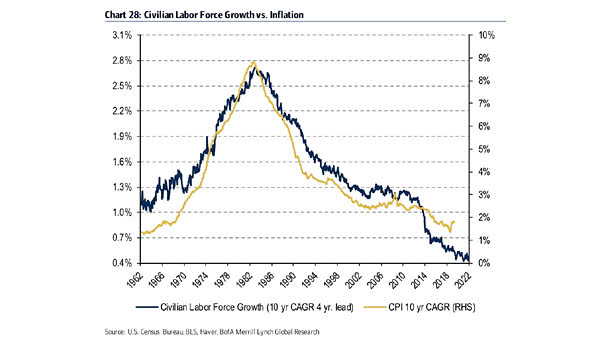
Civilian Labor Force Growth vs. Inflation since 1962 This chart suggests that civilian labor force growth leads CPI by four years. Image: Bank of America Merrill Lynch
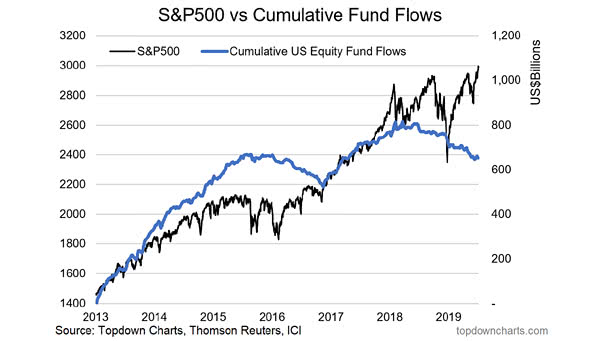
S&P 500 vs. Cumulative Fund Flows “History never repeats itself but it rhymes” said Mark Twain. This chart shows the same trend as for the 2016 period. Image: Topdown Charts
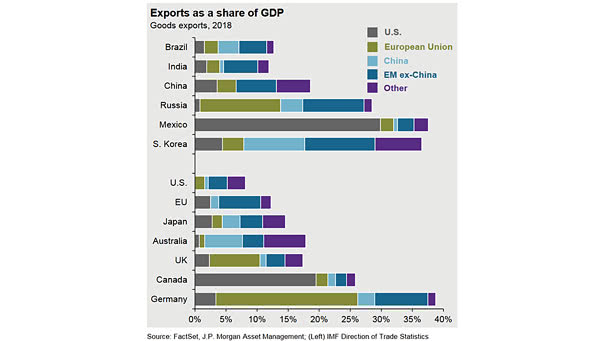
Exports as a Share of GDP Interesting chart showing exports as a percentage of GDP and putting U.S. tariffs into perspective. Source: J.P. Morgan Asset Management