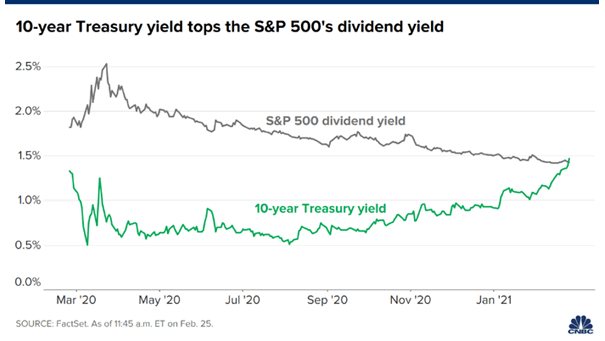
Valuation – S&P 500 Forward P/E

Valuation – S&P 500 Forward P/E At a forward P/E multiple of 20x, the S&P 500 is trading at the low end of the trading range, which is below its 12-month average of 21x. Image: Goldman Sachs Global Investment Research

ISABELNET Cartoon of the Day

ISABELNET Cartoon of the Day Bulls ran wild on Wall Street after the S&P 500’s meteoric 0.51% rise this week, prompting calls for a new economic era, while bears are desperately Googling “how to sell fast!” Have a Great Weekend, Everyone! 😎

ACWI Ex-U.S. vs. U.S. 3-Month Correlation and U.S. Equity 3-Month Return

ACWI Ex-U.S. vs. U.S. 3-Month Correlation and U.S. Equity 3-Month Return When U.S. equities experience a sell-off, it often indicates underlying worries about the global economy or financial system, triggering risk aversion. This typically leads to declines in both domestic and international equities. Image: Goldman Sachs Global Investment Research

Market Capitalization of the Largest Stock Relative to the 75th Percentile Stock

Market Capitalization of the Largest Stock Relative to the 75th Percentile Stock The U.S. equity market is experiencing historically high levels of concentration, primarily driven by the dominance of a small group of mega-cap tech companies. This concentration is at levels not seen in nearly a century. Image: Goldman Sachs Global Investment Research

S&P 500 Corrections and Bear Markets

S&P 500 Corrections and Bear Markets Market corrections don’t always lead to bear markets. In fact, historical data shows that only 13 of the past 39 corrections transitioned into bear markets, giving bulls reason to smile! Image: Carson Investment Research

Number of Calendar Days the Correction Lasted for the S&P 500

Number of Calendar Days the Correction Lasted for the S&P 500 S&P 500 corrections have varied significantly since 1928. The average correction lasts 185 days, with a median of 52 days. Interestingly, in 10 of 60 instances, the S&P 500 was in correction territory for just one day. Image: Deutsche Bank

ISABELNET Cartoon of the Day

ISABELNET Cartoon of the Day While bears are crucial for balancing the market, let’s face it: they’re secretly green with envy when bulls are having all the fun during a rally! Happy Friday, Everyone! 😎

U.S. Equity Flows

U.S. Equity Flows The S&P 500’s correction has not only affected market performance but also altered individual investors’ behavior, with many refraining from “buying the dip” due to increased caution amid economic and market uncertainties. Image: CNBC

Number of Days from 52 Week High of S&P 500 to Correction (-10%) Level

Number of Days from 52 Week High of S&P 500 to Correction (-10%) Level The current market correction stands out for its swift onset. Among 60 corrections since 1928, this one ranks as the 11th fastest to occur from market highs, leading to abrupt shifts in market sentiment. Image: Deutsche Bank

ISABELNET Cartoon of the Day

ISABELNET Cartoon of the Day As the Fed leaves rates unchanged and tariff concerns persist, bulls are navigating markets like a plane battling turbulent skies—holding firm and hoping for a break in the storm! Have a Great Day, Everyone! 😎