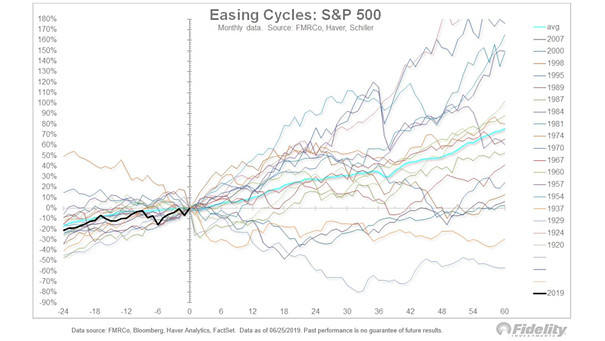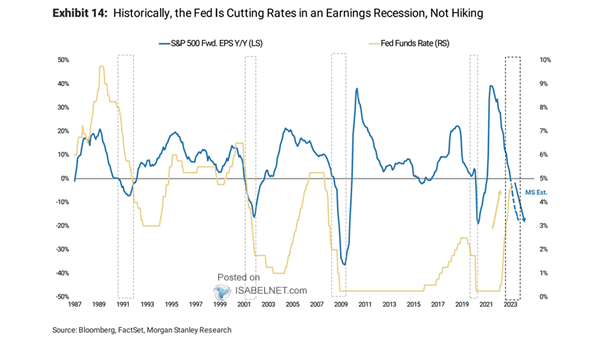
Fed Funds Rate and S&P 500 TTM EPS Growth
Fed Funds Rate and S&P 500 TTM EPS Growth Strong EPS growth, combined with Fed rate cuts, often fuels equities by reducing funding costs, boosting investment and sustaining earnings momentum—the classic drivers of bull markets. Image: TS Lombard