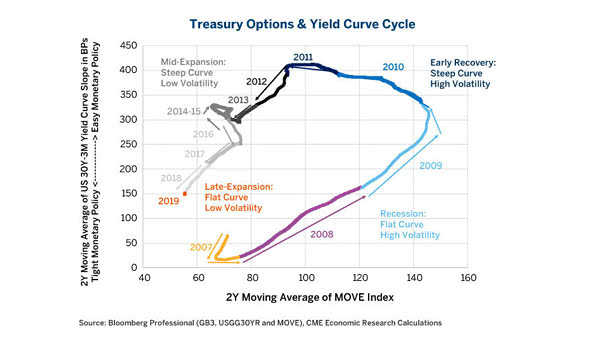
Why the Unemployment Rate to 3.6% in April 2019 Is Not So Great?

Why the Unemployment Rate to 3.6% in April 2019 Is Not So Great? Well, the unemployment level is the lowest since 1969, but when we compare the level of unemployment plus people not in the labor force, to the level of employment, the picture is not so rosy. Ouch!

National Debt of the United States from 1934 to 2019

National Debt of the United States from 1934 to 2019 $22 trillion national debt number is huge. As a comparison, that’s more than the GDP of New Zealand, Singapore and Norway combined. Image: howmuch.net

Does the Sharing Economy Really Know How to Share?

Does the Sharing Economy Really Know How to Share? As Michael A. Gayed pointed out, “Amazing how companies that enable the “sharing economy” make no profit, isn’t it?” The question to ask, does the sharing economy really know how to share? Image: Hedgeye Risk Management LLC

Concentration of Stock Ownership by Wealth Bracket

Concentration of Stock Ownership by Wealth Bracket As the chart shows, the top 20% wealthiest American households own over 93% of stocks. You may also like “How the Composition of Wealth Changes from the Middle Class to The Ultra Rich?” and “U.S. Net Worth by Wealth Bracket.” Image: Visual Capitalist

30-Year Mortgage Rates vs. 10-Year Treasury Yield

30-Year Mortgage Rates vs. 10-Year Treasury Yield There is a very high correlation between the 30-year mortgage rates and the 10-year treasury yield 30-year mortgage rates = 1.739 x (10-year treasury yield)² + 0.7755 x (10-year treasury yield) + 0.0227 R² = 0.9787 Image: Calculated Risk

US Long-Term Mortgage Rates Decline: 30-Year Average 4.10% & 15-Year Average 3.57%

US Long-Term Mortgage Rates Decline: 30-Year Average 4.10% & 15-Year Average 3.57% Why US long-term mortgage rates decline? Mortgage costs are influenced by the 10-year Treasury yield which was lower this week, because the trade war between the United States and China pushes investors moving money from stocks to bonds. Bond yields fall as prices rise.…

Income Shares of the Top 1% in Various Countries

Income Shares of the Top 1% in Various Countries The richest 1% of Americans take 20% of national income, but the richest 1% of the Dutch people only 6%. Denmark and the Netherlands are the countries that are the most equal. Image: World Economic Forum