S&P 500
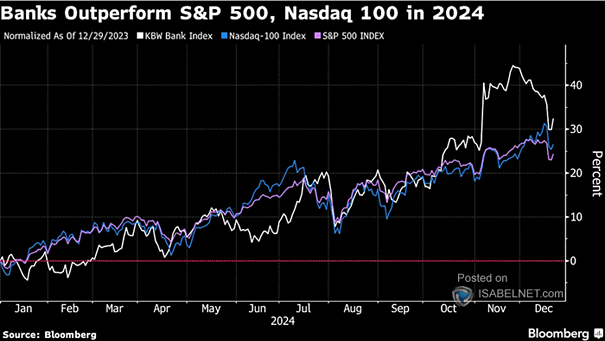
S&P 500 vs. 20+-Year U.S. Treasuries U.S. stocks continue to outperform bonds in an ongoing post-pandemic risk-on rally, despite periods of volatility. Market sentiment remains tilted toward risk assets. Image: Bloomberg
S&P 500 vs. 20+-Year U.S. Treasuries U.S. stocks continue to outperform bonds in an ongoing post-pandemic risk-on rally, despite periods of volatility. Market sentiment remains tilted toward risk assets. Image: Bloomberg
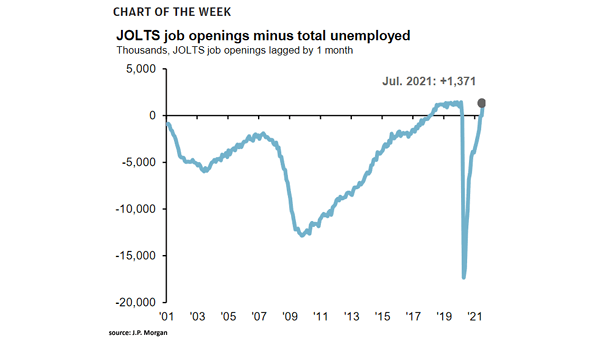
U.S. Labor Market – Job Openings per Unemployed Worker The ratio of U.S. job openings to unemployed workers below 1 indicates labor market weakness, with policy uncertainty and slowing demand increasing the likelihood of a September Fed rate cut. Image: J.P. Morgan Asset Management
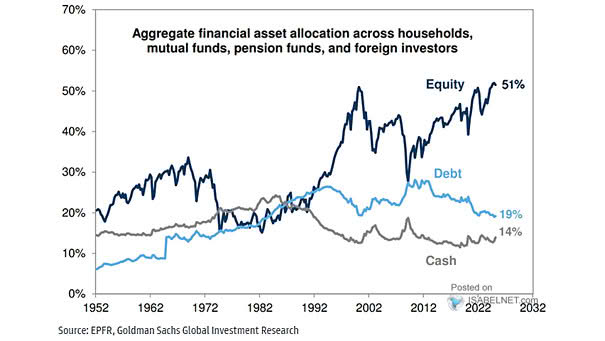
Aggregate Financial Asset Allocation Among Households, Mutual Funds, Pension Funds, and Foreign Investors Investor allocation to equities has reached an all-time high, driven by retail enthusiasm and strong performance. However, rising valuations and concentrated leadership call for careful risk management. Image: Goldman Sachs Global Investment Research
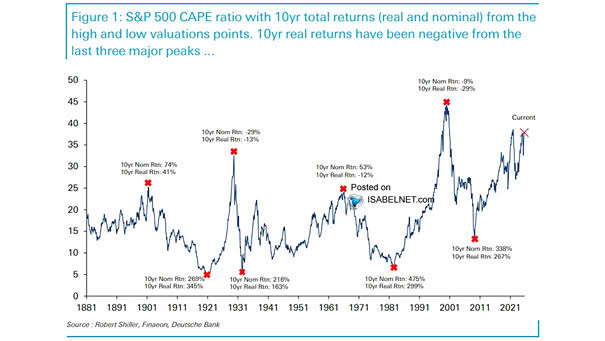
Valuation – S&P 500 CAPE Ratio with 10-Year Total Returns Valuations don’t matter—until they do. Over the past 150 years, high valuations have been a sign of poor forward returns, with negative real returns over 10 years following the last three major valuation peaks. Image: Deutsche Bank
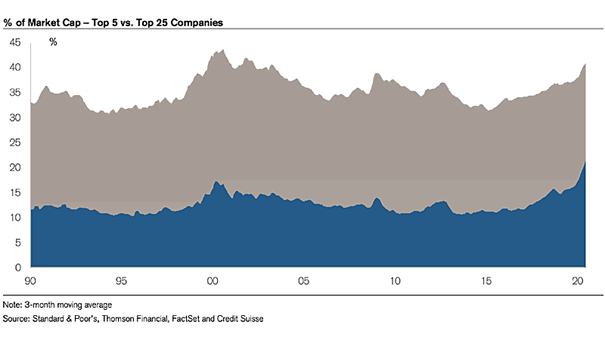
Share of Top 5 Companies by Market Capitalization in the S&P 500 The U.S. equity market is highly concentrated in just a few mega-cap tech companies. While this does not definitively mean the U.S. is in a bubble, investors face uncharted waters as performance hinges on a few key players. Image: Deutsche Bank
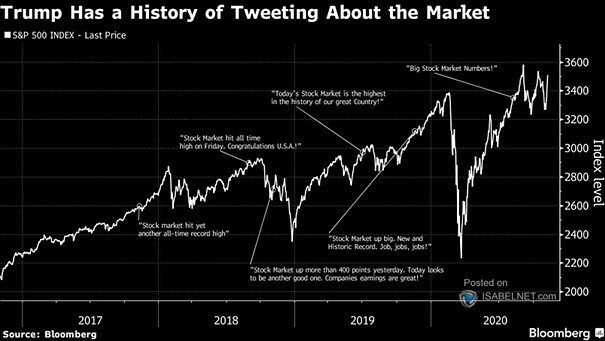
President Trump Tweets Contribute to Market Volatility President Trump’s tweets during his first term had a significant impact on financial markets, often contributing to increased volatility. During Trump’s second term, the dynamics appear similar. Image: Bloomberg
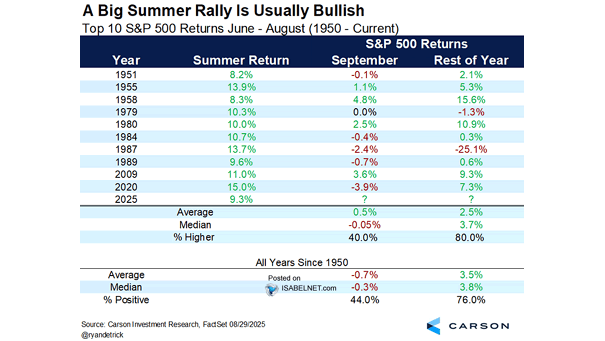
Top 10 S&P 500 Returns June – August A strong summer rally, such as the one in 2025, typically signals bullish sentiment and often leads to further gains in the S&P 500 for the remainder of the year, based on historical trends observed in the ten best summer rallies. Image: Carson Investment Research
Average and Median Monthly 10-Year U.S. Treasury Yield Change Since 2000 U.S. Treasury bond yields typically increase in September and October due to a surge in bond supply after the summer lull, combined with market influences like policy shifts and investor repositioning. Image: Deutsche Bank
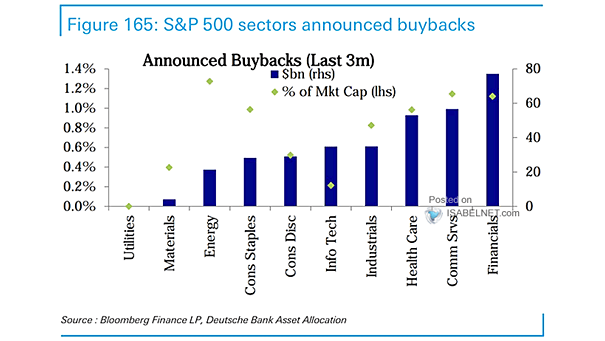
S&P 500 Sectors Announced Buybacks (Last 3 Months) Over the past three months, the Financial, Industrial, and Information Technology sectors have been at the forefront of buyback announcements, driving a major portion of repurchase activity in the U.S. market. Image: Deutsche Bank Asset Allocation
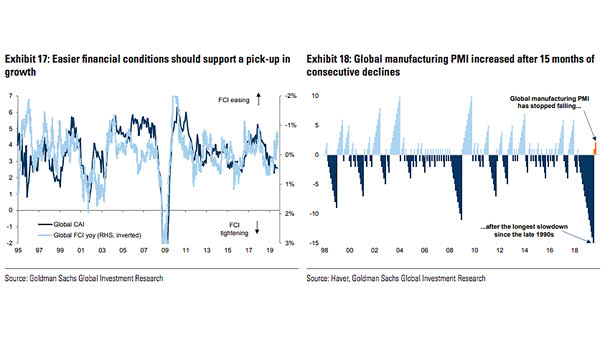
Global Financial Conditions Index Global financial conditions have eased to a 12-month low, supported by expectations of monetary policy easing, improved investor sentiment, tightening credit spreads, and a more stable economic outlook. Image: Goldman Sachs Global Investment Research
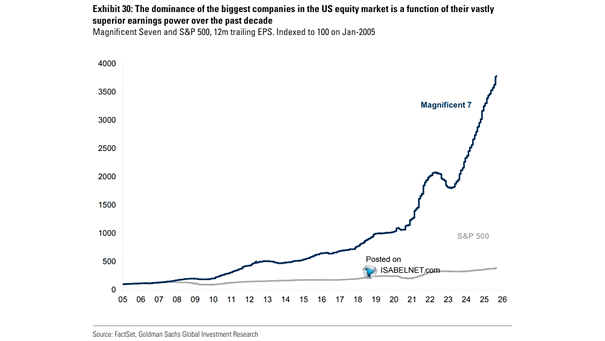
Magnificent Seven and S&P 500 – 12-Month Trailing EPS The strong earnings power and consistent profit growth of the largest U.S. companies have been key factors in maintaining their dominant positions in the U.S. equity market over the past decade. Image: Goldman Sachs Global Investment Research