Inflation – U.S. CPI Deviation from Consensus

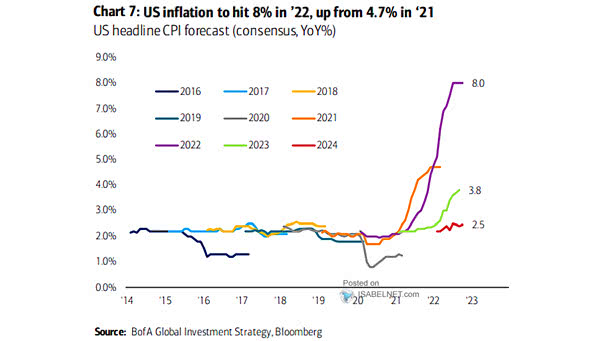
Inflation – U.S. CPI Deviation from Consensus A series of lower-than-expected inflation readings gives the administration greater economic leeway to pursue higher tariffs, driven by the (possibly mistaken) belief that U.S. consumers will be largely insulated from their effects. Image: Deutsche Bank

S&P 500 – Share of Sales Derived from Outside United States

S&P 500 – Share of Sales Derived from Outside United States The “Magnificent Seven” tech giants are more exposed to global trade risks than the rest of the S&P 500, as 49% of their revenue comes from foreign sales. Image: Goldman Sachs Global Investment Research

S&P 500 – Cumulative Total % Return of the Top 10 U.S. Companies

S&P 500 – Cumulative Total % Return of the Top 10 U.S. Companies Since 2000, maintaining dominance and consistently beating the S&P 500 has eluded almost all top-ten stocks except for rare cases like Microsoft. Current market leaders could defy history, but past evidence suggests it’s a high bar. Image: Deutsche Bank

S&P 500 Index Returns in July

S&P 500 Index Returns in July Historically, the U.S. stock market tends to peak around this time in July. Given both seasonal and technical patterns, it would be perfectly normal for the current powerful 26% rally off the April lows to take a pause. Image: Carson Investment Research

S&P 500 Cycle Composite

S&P 500 Cycle Composite The S&P 500 Cycle Composite points to a less bullish period of the year, with 2025 so far following typical seasonal patterns: early strength, mid-year volatility, and a potential year-end rally. Image: Ned Davis Research

Return on Equity (ROE) : S&P 500 vs. MSCI World ex. U.S.

Return on Equity (ROE) : S&P 500 vs. MSCI World ex. U.S. U.S. stocks have significantly outperformed their global peers in recent years, driven by the superior return-on-equity of American companies—a key factor reinforcing the structural advantages of the U.S. market. Image: Goldman Sachs Global Investment Research

Foreign Revenues by Region for the S&P 500

Foreign Revenues of S&P 500 Companies While S&P 500 companies are broadly exposed to global markets, the majority of their sales—and thus, much of their operational and macroeconomic risk—remains tied to the U.S. economy. Image: Goldman Sachs Global Investment Research

Share of Tariff Cost Burden

Share of Tariff Cost Burden While the importer of record pays the tariff legally, the economic cost of tariffs is distributed across U.S. consumers, U.S. businesses that rely on imports, and foreign exporters. Image: Goldman Sachs Global Investment Research

International vs. Domestic Exposure

International vs. Domestic Exposure Export-oriented U.S. stocks surged after the tariff pause announcement, reflecting growing investor optimism over easing trade tensions—though potential tariff policy changes remain key factors to watch. Image: Bloomberg

S&P 500 Aggregate Earnings Beat

S&P 500 Aggregate Earnings Beat A 5% earnings beat reflects the typical surprises seen in past quarters and suggests that actual reported earnings will modestly exceed consensus estimates, consistent with the historical pattern of positive earnings surprises. Image: Deutsche Bank Asset Allocation

S&P 500 Annual Price Returns

S&P 500 Annual Price Returns The S&P 500’s performance in 2025 so far aligns with median historical gains seen during non-recessionary periods. The market outlook remains cautiously optimistic, driven by moderate earnings growth and supportive monetary policy. Image: Deutsche Bank Asset Allocation