
ISABELNET Cartoon of the Day
ISABELNET Cartoon of the Day When bulls sense a market boom, bears are quick to dismiss it, claiming there’s “nothing to see here.” Have a Great Day, Everyone! 😎
ISABELNET Cartoon of the Day When bulls sense a market boom, bears are quick to dismiss it, claiming there’s “nothing to see here.” Have a Great Day, Everyone! 😎
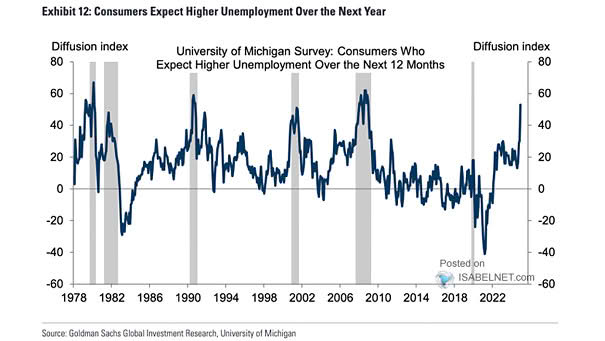
University of Michigan Survey – Consumer Who Expect Higher Unemployment over the Next 12 Months The latest University of Michigan Surveys of Consumers indicate that a significantly higher share of Americans now expect unemployment to rise over the next year, reaching the highest level since 2009. Image: Goldman Sachs Global Investment Research
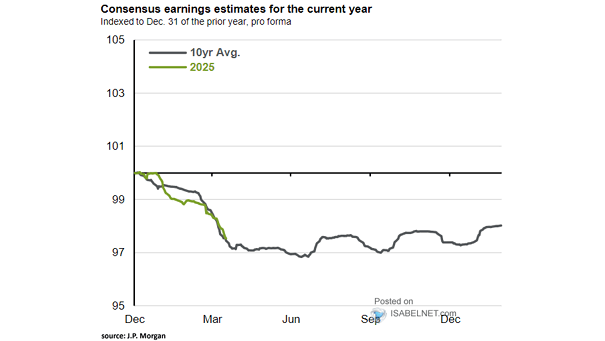
Consensus Earnings Estimates Despite economic uncertainties and potential tariff impacts, downward revisions to 2025 EPS estimates have remained modest, underscoring their resilience. Image: J.P. Morgan Asset Management
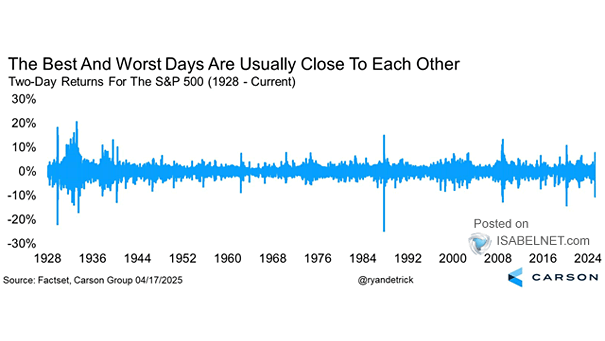
Two-Day Returns for the S&P 500 The clustering of best and worst days underscores the importance of patience and discipline in investing. Selling after the worst days often means missing the best days that follow! Image: Carson Investment Research
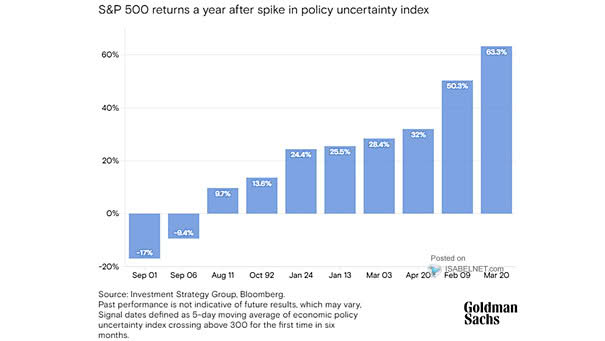
S&P 500 Returns a Year After Spike in Policy Uncertainty Index The S&P 500 has a history of generating solid 12-month returns after periods of heightened policy uncertainty. Image: Goldman Sachs Global Investment Research

ISABELNET Cartoon of the Day Even bulls and bears are calling a truce this Easter Monday—time to trade market chaos for chocolate eggs! Happy Easter Monday, Everyone!🐰😎
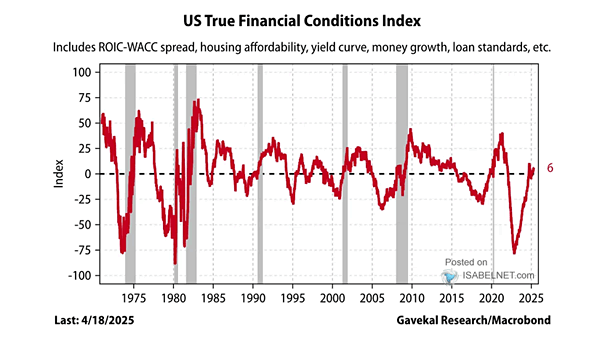
U.S. True Financial Conditions Index The U.S. True Financial Conditions Index stands at 6, indicating a slightly accommodative financial environment. Image: Gavekal, Macrobond
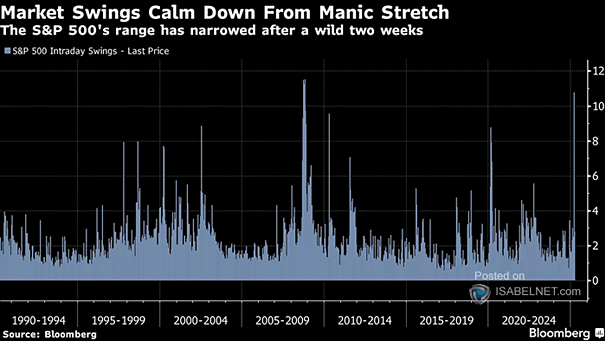
S&P 500 Intraday Swings Recent S&P 500 volatility, characterized by intraday swings exceeding 10% and VIX spikes echoing 2008 and COVID-era turbulence, appears to be stabilizing. Image: Bloomberg
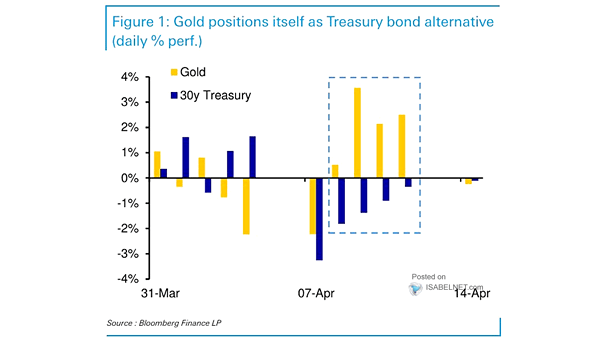
Gold vs. 30-Year U.S. Treasury Bond Gold is increasingly being positioned as an alternative to U.S. Treasury bonds. Image: Deutsche Bank

ISABELNET Cartoon of the Day The S&P 500 took a 1.50% dip this week, but bears are open to talks if bulls show respect! Happy Easter Weekend, Everyone! 🐰😎
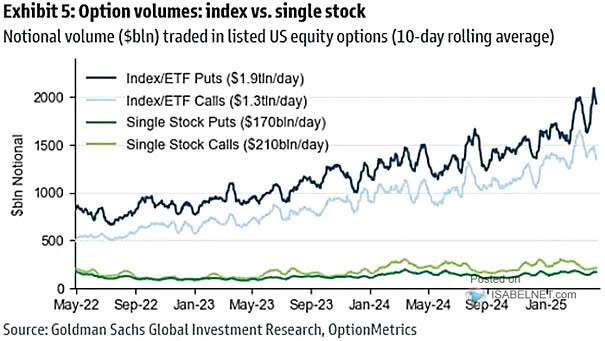
Notional Volume Traded in Listed U.S. Equity Options Thanks to strong participation from both retail and institutional investors, U.S. equity options are seeing rising average daily trading volumes—a trend that shows no signs of slowing down. Image: Goldman Sachs Global Investment Research