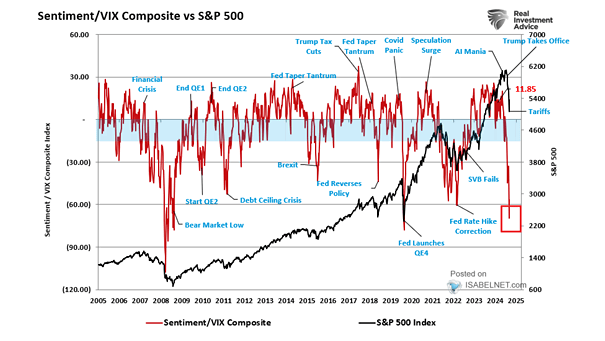
China and Taiwan Manufacturing PMI
China and Taiwan Manufacturing PMI The charts suggest a bottom in the Chinese and Taiwanese cycle in early 2020. Historically, this has been positive for global equities. Image: Danske Bank Research
ISM Manufacturing Index vs. Semiconductors Semiconductors are discounting a substantial rise in the U.S. ISM Manufacturing PMI, which suggests a robust expansion in manufacturing activity and overall economic growth. Image: BofA Global Investment Strategy
U.S. Stock Market Performance When Market Fell > 8% in 6 Consecutive Losing Sessions This chart shows the U.S. stock market performance since 1948, when the market fell more than 8% in 6 consecutive losing sessions, with PMI > 50 and PMI < 50. Image: Fundstrat Global Advisors, LLC
200D Change in Yield Curve 30Y-10Y Leads U.S. ISM Manufacturing Index This great chart suggests that 200-Day Change in Yield Curve 30-Year minus 10-Year spread leads U.S. ISM Manufacturing Index by 16 months. It also suggests that U.S. PMI is probably bottoming now and could bounce back. Image: Fundstrat Global Advisors, LLC