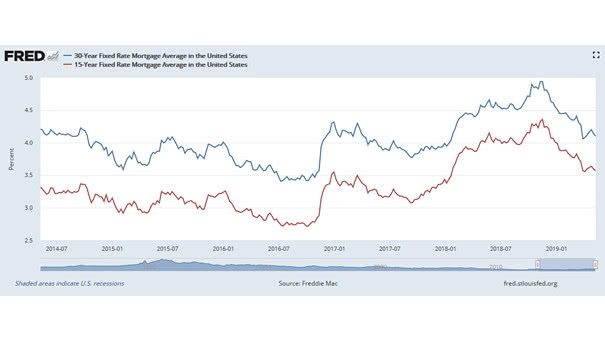
US Long-Term Mortgage Rates Decline: 30-Year Average 4.10% & 15-Year Average 3.57%
US Long-Term Mortgage Rates Decline: 30-Year Average 4.10% & 15-Year Average 3.57% Why US long-term mortgage rates decline? Mortgage costs are influenced by the 10-year Treasury yield which was lower this week, because the trade war between the United States and China pushes investors moving money from stocks to bonds. Bond yields fall as prices rise.…