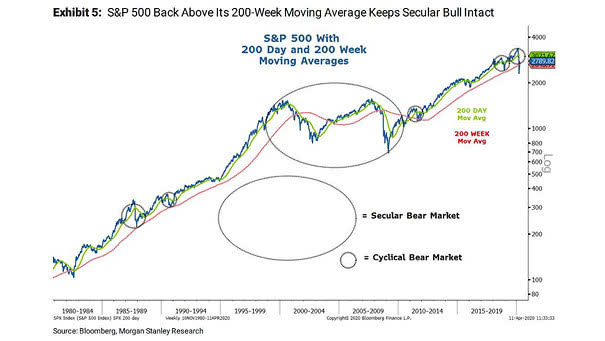
% of S&P 500 Members Above 200-Day Moving Average

% of S&P 500 Members Above 200-Day Moving Average This chart shows that breadth across stocks and sectors had been weakening, even though the S&P 500 was climbing to new highs. Image: Deutsche Bank Asset Allocation

S&P 500 and Moving Average

S&P 500 and Moving Average When the 200-day moving average is back above the 400-day moving average, it tends to be bullish for the S&P 500. Image: Commonwealth Financial

S&P 500 3-Month Realized Average Stock Correlation

S&P 500 3-Month Realized Average Stock Correlation U.S. stock correlations have recently surged to their highest levels since late 2022, indicating that stocks are moving more in tandem than usual—a trend that typically emerges during periods of heightened uncertainty or market stress. Image: Goldman Sachs Global Investment Research

Gold / U.S. Average Worker’s Wage

Gold / U.S. Average Worker’s Wage Despite a bullish outlook fueled by declining interest rates and ongoing central bank purchases, gold is seen as expensive relative to the average wage of a U.S. worker. Image: Gavekal, Macrobond

Recession Indicator – Unemployment Rate (3-Month Average) Relative to Prior 12-Month Low

Recession Indicator – Unemployment Rate (3-Month Average) Relative to Prior 12-Month Low Even if the unemployment rate is a lagging indicator, the “Sahm recession indicator” forecasts a recession when the 3-month moving average national unemployment rate exceeds its minimum over previous 12 months by 0.5 percentage points. Picture source : Claudia Sahm, Board of Governors…