FANG Stocks and 200-Day Moving Average
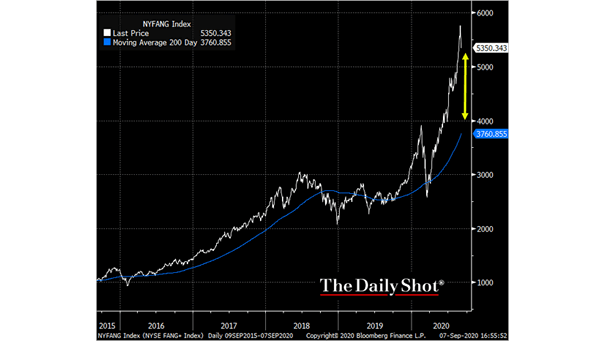
FANG Stocks and 200-Day Moving Average How high above the 200-day moving average can FANG stocks get? Should investors be concerned? Image: The Daily Shot
FANG Stocks and 200-Day Moving Average How high above the 200-day moving average can FANG stocks get? Should investors be concerned? Image: The Daily Shot
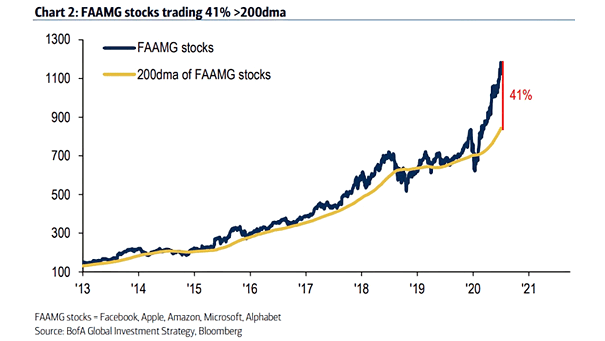
200-Day Moving Average of FAAMG Stocks Trading at 41% above the 200-day moving average appears stretched, but it’s important not to lose sight of the big picture. Image: BofA Global Investment Strategy

Nasdaq 100 Deviation from 200-Day Moving Average The risk of a reversion grows, as the Nasdaq 100 trades 2-standard deviations above the 200 DMA. Image: Scotiabank GBM Portfolio Strategy
S&P 500 vs. Percentage of Stocks Above 50-Day Moving Average Chart showing the current divergence between the S&P 500 and the percentage of stocks trading above their 50-day moving average. Image: Fidelity Investments
Euro Stoxx 50 and 200-Day Moving Average The Euro Stoxx 50 is testing its 200-day moving average, suggesting some resistance for further gains. Image: The Daily Shot
S&P 500 and >11% Above 50-Day Moving Average Short-term overbought, but historically, >11% above 50-day moving average has been bullish. Image: LPL Research
S&P 500 and % of Stocks Above their 200-Day Moving Average More than 90% of S&P 500 stocks are trading above their 50-day moving average, but just 47% are above their 200-day moving average today. This chart suggests there’s room for improvement. Image: Scotiabank GBM Portfolio Strategy
More than 90% of Stocks above 50-Day Moving Average Short-term overbought, but historically, more than 90% of stocks above the 50-day moving average is bullish. Image: Strategas Research Partners
More than 90% of S&P 500 Index Components above their 50-Day Moving Average The past 11 times that more than 90% of S&P 500 index components were above their 50-day moving average, the S&P 500 was higher 10 times and up +15.9% on average. Image: LPL Research
Secular Bull Market – The S&P 500 and Its 200-Week Moving Average The 200-week moving average is a strong support level, suggesting that the secular bull market is still intact for the time being. Image: Credit Suisse
Secular Bull Market – S&P 500 with 200-Day and 200-Week Moving Averages This chart suggests that the secular bull market is intact, as the 200-week moving average is a strong support level. Image: Morgan Stanley Research