STOXX Europe 600 EPS Revisions
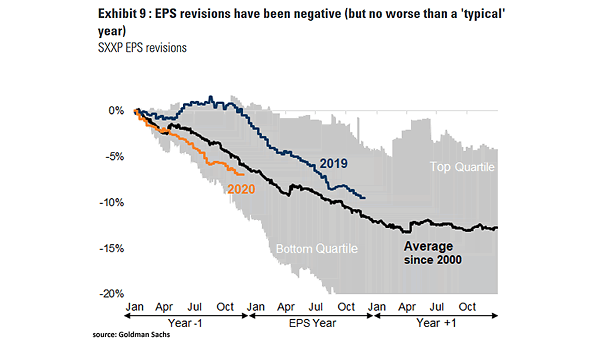
STOXX Europe 600 EPS Revisions This year, SXXP EPS revisions have not been worse than a typical year. Image: Goldman Sachs Global Investment Research
STOXX Europe 600 EPS Revisions This year, SXXP EPS revisions have not been worse than a typical year. Image: Goldman Sachs Global Investment Research
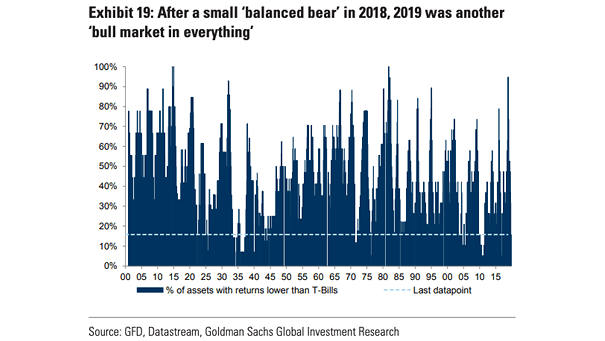
Bull Market: Percentage of Assets With Returns Lower Than T-Bills 2019 was a ‘bull market in everything’. Should investors be worried? Image: Goldman Sachs Global Investment Research

Distribution of Subsequent S&P 500 Returns From Different Levels of 12M Forward P/E Chart suggesting that equity returns can be strong, even though U.S. equities are currently expensive. Image: Goldman Sachs Global Investment Research
Average Valuation Percentile: Equity, Bond, Credit Chart suggesting that credit and equities look expensive, while bonds are the most expensive. Image: Goldman Sachs Global Investment Research
U.S. Interest Rate-Growth Differential and Short-Term Lending Rate Since 1880, U.S. interest rates have been higher than growth 32% of the time. Image: Goldman Sachs Global Investment Research
Median S&P 500 12-Month Returns Based on Control of U.S. Government A unified government under the Democrats could represent a major risk for the S&P 500 in 2020. Image: Goldman Sachs Global Investment Research
Effect of Fiscal Policy on U.S. Real GDP Growth This chart suggests a negative effect of fiscal policy on real GDP growth in 2020. Image: Goldman Sachs Global Investment Research
Valuation – Relative P/E High vs. Low Dividend Yield Stocks This chart suggests that stocks that pay large dividends haven’t been so cheap since around 1980, relative to low dividend yield stocks. Image: Goldman Sachs Global Investment Research
S&P 500 Forecast for 2020 Goldman Sachs forecasts a price-target for the S&P 500 at 3400 by year-end 2020, and a downside scenario at 2600 depending on tariffs and the US election result. Image: Goldman Sachs
Broad Trade-Weighted U.S. Dollar Forecast Chart suggesting that the U.S. dollar is expected to weaken in 2020, as global economic activity improves. Image: Goldman Sachs Global Investment Research
U.S. Corporate Leverage U.S. corporate leverage is high and close to its previous peak on a net debt to EBITDA. Image: Goldman Sachs Global Investment Research