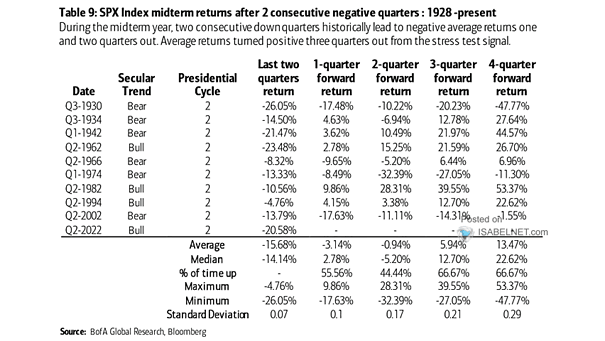
S&P 500 Index Returns YTD at the End of April
S&P 500 Index Returns YTD at the End of April Will the rest of the year be much better than average for the S&P 500? Image: LPL Research
Pullbacks and Returns a Year Off the Lows for the S&P 500 Index Based on the 4-Year Presidential Cycle Historically, the S&P 500 average intra-year pullback from peak to trough has been more than 17% in midterm years. Image: LPL Research
Returns – S&P 500 Index Pullbacks During a Midterm Year Pullbacks are normal during a midterm year. Historically, U.S. stocks are up more than 30% on average a year later. Image: LPL Research
Average Net Buying (Selling) of U.S. Single Stocks by Institutional and Private Clients Can tax-loss harvesting improve investor returns? Image: BofA Securities
S&P 500 3-Month Return Dispersion Return dispersion remains below the long-term average. Image: Goldman Sachs Global Investment Research
Returns for Portfolio of 25% in Global Equities, Bonds, Commodities, Cash A diversified portfolio of 25% in global equities, bonds, commodities and cash is annualizing a 16% return, well above the historical average. Image: BofA Global Investment Strategy
20-Year Annualized Returns by Asset Class The average American investor still underperforms the market over the long term, generally due to panic selling, emotional biases, the herding effect and lack of diversification. Image: J.P. Morgan Asset Management
% of Stocks Above 50-Day Moving Average When S&P 500 At Record Narrow breadth in S&P 500 could suggest below average market returns. Image: Bloomberg
Returns – G7 + China Free Liquidity and MSCI ACWI (Leading Indicator) Global free liquidity continues to rise. When global free liquidity is above 10%, equity markets tend to perform well: the average next 12-month return is 23.4% with a hit ratio of 100% since 2009. Image: BofA Global Research
Small Cap Stocks – Russell 2000 Total Return Bases on President/Congress Since 1979 Historically, small caps’ highest average returns have been in period of Democratic President with a Democratic Congress. Image: BofA US Equity & Quant Strategy
S&P 500 – Return vs. Volatility Despite above average volatility, the coronavirus pandemic drove strong market gains in 2020. Image: Fidelity Investments