Global Fixed Income Market In Different Yield Buckets
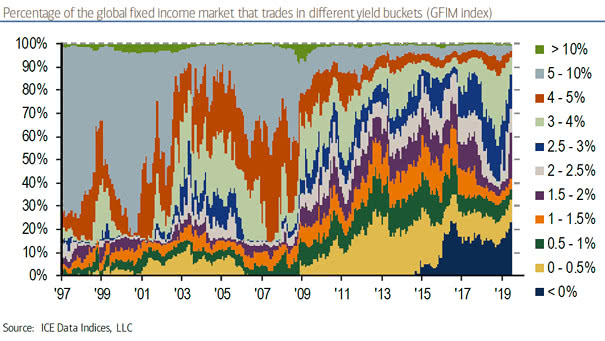
Global Fixed Income Market In Different Yield Buckets Nowadays, the scarcity of yield with 20% of global bonds below 0%. Image: ICE Data Indices, Bank of America Merrill Lynch
Global Fixed Income Market In Different Yield Buckets Nowadays, the scarcity of yield with 20% of global bonds below 0%. Image: ICE Data Indices, Bank of America Merrill Lynch
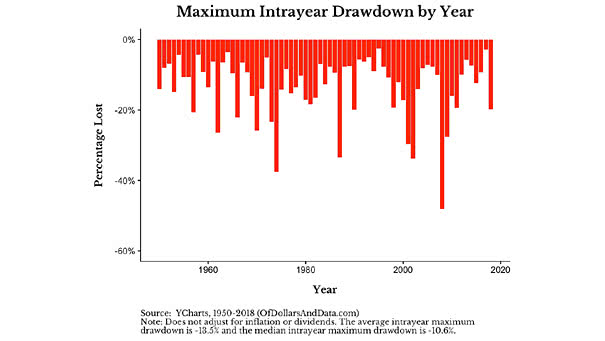
Maximum Intra-Year Drawdown for the S&P 500 Since 1950, the median maximum drawdown for the S&P 500 is -10.6% and the average is -13.5%. You may also like “S&P 500 Index Drawdowns From 2 Year Highs.” Image: Of Dollars And Data

Maximum Drawdown vs. Annual S&P 500 Returns The annual return of the S&P 500 can be positive, even after a large drawdown. Image: Of Dollars And Data
World Population in 2018 Interesting world map: the country’s size represents the size of the population. You may also like “World Population & Demographics – More People Over 65 than Under 5 for the First Time.” Image: Our World in Data Click the Image to Enlarge
U.S. Bond ETFs Top Inflows Record In June, investors significantly increased their exposure to bond funds, as weak economic data fuels slowdown worries. U.S. bond ETFs inflows hit $25.4bn. Image: Financial Times
Most Important Variables Explaining the S&P 500’s YoY Return Today, the two most important variables explaining the S&P 500’s YoY return: FOMC rate change and U.S. hard economic data. Image: Arbor Research & Trading LLC
Second-half Recovery in Growth? Better economic data could extend the business cycle. Currently, G7 & BRIC leading indicators remain encouraging and suggest no imminent recession. Image: Richardson Wealth
U.S. Leveraged Loan Index Rating Breakdown: 2008 vs. 2019 Since 2008, this chart shows that U.S. leveraged loans are getting lower ratings. Any drop in the credit ratings could also amplify the next recession. Image: Standard & Poor’s Leveraged Commentary & Data, UBS
Lower Returns for Stocks in the Next 12 Months? Morgan Stanley’s cyclical indicator is flagging “downturn.” The yield curve’s slope, debt issuance, consumer confidence, economic and financial markets data are aggregated in Morgan Stanley’s cyclical indicator. The entry into the “downturn” phase suggests lower returns for stocks and risky assets in the next 12 months. Image:…
Decomposing the U.S. 10-Year minus 3-Month Treasury Yield Spread since 2013 This great chart shows that the “Global Economic Data” variable has a significant impact on the U.S. 10-year minus 3-month Treasury yield spread since 2018. An R² of 0.902 means that more than 90 percent of the variance in the U.S. 10-year minus 3-month Treasury yield spread…
Gold Reserves Around the World The U.S. has the world’s largest gold reserves, followed by Germany, the International Monetary Fund (IMF) and France. Image: howmuch.net Click the Image to Enlarge