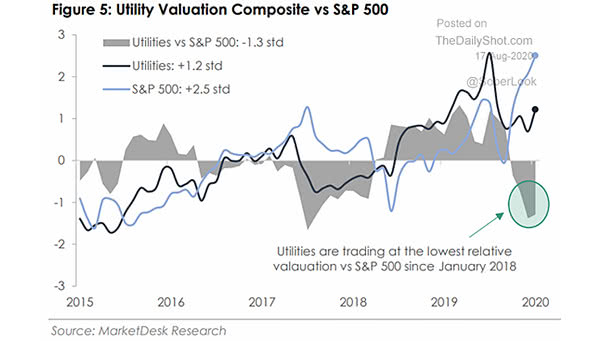
Utility Valuation Composite vs. S&P 500
Utility Valuation Composite vs. S&P 500 Could utilities outperform the S&P 500? Image: MarketDesk Research
Utility Valuation Composite vs. S&P 500 Could utilities outperform the S&P 500? Image: MarketDesk Research
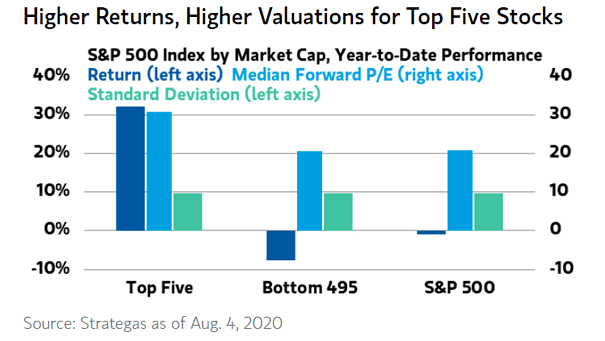
S&P 500 Index Market Capitalization, YTD Performance Higher returns YTD, but higher valuations for the top five stocks. Image: Morgan Stanley Wealth Management

Valuation – Defensive Assets vs. Assets More Sensitive to the Economy Valuations suggest that we’re a long way from a return to normal times, as the market remains concerned about long-term growth. Image: Morgan Stanley Research
Equity Over-Valuation Composite Indicator Is the current stock market the most overvalued since 1998? 78% of FMS investors think so. Image: BofA Global Fund Manager Survey
Valuation – Number of S&P 500 Members with 14 Day RSI Above 70 Market complacency is high, as the RSI level is getting into overbought condition for many S&P 500 stocks. Image: The Daily Shot
Valuation – GS Top-Down vs. Consensus Bottom-Up Estimates of 2020 EPS Growth This chart suggests that equity market valuations are too high, as current stock prices do not reflect the scale of earnings declines in a recession. Image: Goldman Sachs Global Investment Research
Earnings, Dividends and Valuation Chart showing the deviation of the S&P 500 Index against its trend line. The U.S. stock market needs earnings growth to rise this year. Image: Fidelity Investments
Price Relative of MSCI World vs. Emerging Markets ex-China Emerging markets ex-China benefit from modernization potential, favorable demographics, and attractive valuations for the long term, according to BofA. Image: BofA Global Research
S&P 500 Valuation Metric Is the U.S. equity market overvalued? The S&P 500’s median valuation metric is in the 89th percentile. That’s not cheap by historical standards. Image: Goldman Sachs Global Investment Research
Global Valuation Map This chart shows global valuation estimates across various countries, and suggests that the U.S. stock market is overvalued by +4%. Image: Morningstar Research
Valuation – Forward P/E Ratio From the valuation peak of January 2018, most P/E ratios have seen drawdowns of 20%-30%, making this feel like a bear market. Image: Fidelity Investments