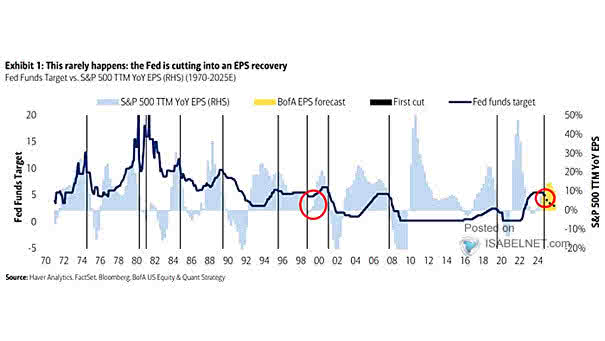
S&P 500 TTM YoY EPS vs. Fed Funds Target
S&P 500 TTM YoY EPS vs. Fed Funds Target Traditionally, when the Fed starts cutting interest rates, corporate profits tend to decelerate. However, this’s not the case today, highlighting the unique economic landscape we face. Image: BofA US Equity & Quant Strategy