South Korea Exports vs. MSCI World EPS
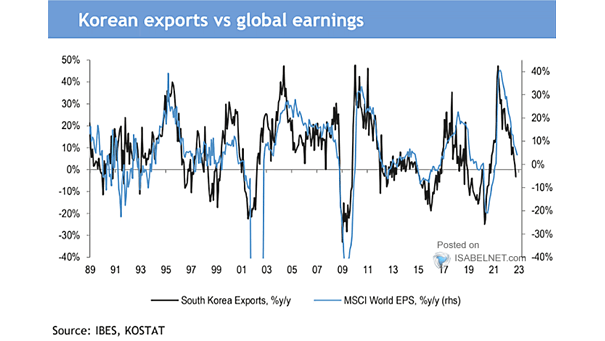
South Korea Exports vs. MSCI World EPS South Korea’s exports tend to lead global earnings. Image: J.P. Morgan
South Korea Exports vs. MSCI World EPS South Korea’s exports tend to lead global earnings. Image: J.P. Morgan
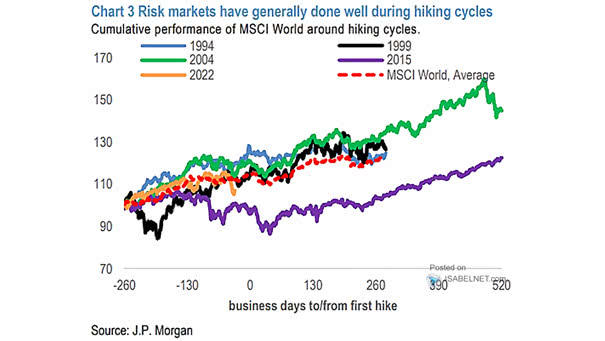
Cumulative Performance of MSCI World Around Hiking Cycles Historically, global equity markets have performed well during hiking cycles. Image: J.P. Morgan

Valuation – Price/Earnings Ratio, S&P 500 vs. MSCI World Ex-U.S. Should equity investors consider overseas stocks? Image: Morgan Stanley Wealth Management
MSCI World Value Index/MSCI World Growth Index vs. Global Agg. Treasuries Index, Yield to Worst Value should outperform Growth and follow the rise in global rates. Image: Morgan Stanley Wealth Management
Performance – MSCI World Ex-U.S. and MSCI U.S. It has not paid to bet against U.S. stocks so far this year, as the gap between the U.S. stock market and stocks from the rest of the world continues to widen. Image: The Daily Shot
Valuation – U.S. 10-Year Real Yield and MSCI World Index Forward Price/Earnings Ratio The price of global equities is expected to fall, if U.S. real yields rise. Image: Morgan Stanley Wealth Management
Valuation – U.S. 10-Year Real Yields and MSCI World N12M PE (Inverted) If U.S. real yields rise, the price of global equities is expected to fall. Image: Morgan Stanley Research
MSCI World Value vs. Growth Relative Index and U.S. 10-Year Real Yields Value tends to outperform growth as U.S. real rates rise (R² = 0.93). Image: Morgan Stanley Research
MSCI World Around Bear Markets After the shortest, and one of the sharpest bear markets in history, the MSCI World recovery is still better than post-GFC. Image: Goldman Sachs Global Investment Research
MSCI World vs. U.S. 10-Year Bond Performance Around Bear Markets After the shortest, and one of the sharpest bear markets in history, the equity vs. bond performance is now better than post-GFC. Image: Goldman Sachs Global Investment Research
MSCI World Value vs. Growth Around Bear Markets So far, the performance of value vs. growth remains worse than post-GFC. Image: Goldman Sachs Global Investment Research