European Stocks and MSCI World
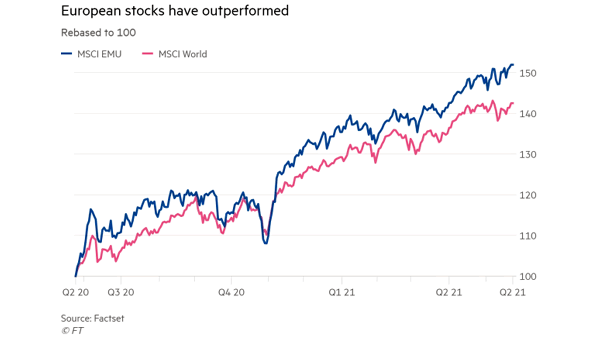
European Stocks and MSCI World Will European stocks continue to outperform global equities? Image: Financial Times
European Stocks and MSCI World Will European stocks continue to outperform global equities? Image: Financial Times
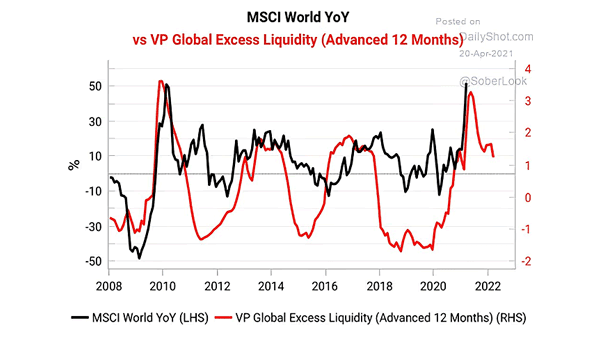
MSCI World YoY vs. VP Global Excess Liquidity (Leading Indicator) Global excess liquidity tends to lead the MSCI World Index by 12 months. Image: Variant Perception Research

Performance – S&P 500 vs. MSCI World vs. MSCI World Ex-US Can the S&P 500 continue to outperform global equity markets over the next 10 years? Image: Financial Times
MSCI World and World Technology 12-Month Forward Earnings Yield Minus U.S. 10-Year Bond Yield Over the last 4 years, the MSCI World tended to decline when the yield gap was close to 2%. Image: Societe Generale Cross Asset Research
Valuation – Cyclical Adjusted P/E Ratio – MSCI U.S. vs. MSCI World Ex-U.S. Are global equities ex-U.S. a bargain? Image: Gavekal, Macrobond
MSCI World Recoveries out of Bear Markets since 1970 After the shortest, and one of the sharpest bear markets in history, the MSCI World recovery is comparable to post-Global Financial Crisis. Image: Goldman Sachs Global Investment Research
MSCI World Index Around Bear Markets Since 1970 After the shortest, and one of the sharpest bear markets in history, the MSCI World is up 12% for the year. Image: Financial Times
MSCI World Index with China Exposure vs. MSCI World Index Investors have noticed that China emerged from recession months ago. Image: Morgan Stanley Research
Global Money Supply and MSCI World Index Global equities are around 1 standard devation vs. global money supply. It could be bullish for stocks, as global money supply growth tends to push equities higher. Image: Nordea and Macrobond
Energy Stocks – MSCI World Energy Index and Book Value Are energy stocks a buying opportunity? Image: Gavekal, Macrobond
MSCI World Value vs. Growth YTD Will global value stocks continue to underperform global growth stocks, as the global economy rebounds? Image: J.P. Morgan