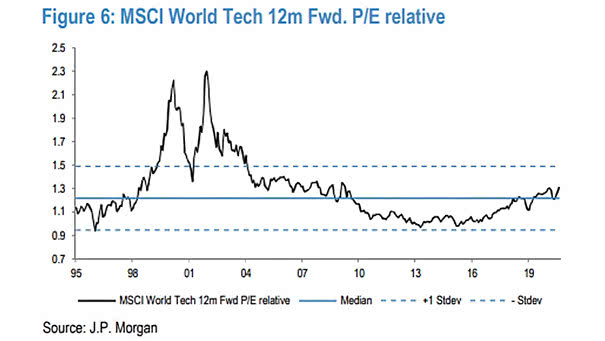
Valuation – MSCI World Tech 12M Fwd P/E Relative
Valuation – MSCI World Tech 12M Fwd P/E Relative Chart suggesting that MSCI World Tech relative P/E doesn’t appear expensive. Image: J.P. Morgan
Valuation – MSCI World Tech 12M Fwd P/E Relative Chart suggesting that MSCI World Tech relative P/E doesn’t appear expensive. Image: J.P. Morgan
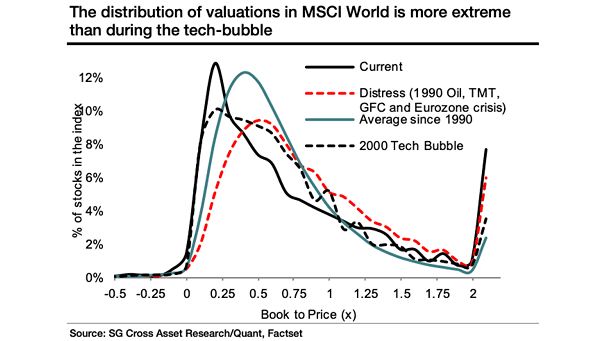
The Distribution of Valuations in MSCI World Has the MSCI World become too expensive? Image: Societe Generale Cross Asset Research

MSCI World Median Correction and Recovery vs. Current Drawdown This charts shows a “beautiful V” and puts the current drawdown into perspective. Image: Ken Fisher, Fisher Investments
Performance – MSCI World, Global Alternative Energy Stocks vs. Traditional Energy Stocks Alternative energy stocks around the world have significantly outperformed traditional energy stocks since 2019. Image: Gavekal, Macrobond
Price Return Indexes – MSCI World ex-US and US Valueline Composite Index Where is the bull market exactly? Today, the Valueline composite index, considered as a proxy for the U.S. market’s performance, stands at the same level as in 1998. Image: Gavekal, Macrobond
MSCI World Growth Index vs. MSCI World Value Index Will global value stocks outperform global growth stocks in the recovery phase? Image: The Daily Shot
Valuation – Mega-Cap U.S. Tech Stocks (FAAMG) vs. MSCI World ex-US Could mega-cap U.S. stocks be in a bubble? Over the past 6 years, prices have increased five-fold, while earnings have only doubled. Image: Gavekal, Macrobond
Global Real M1 vs. MSCI World Total Return (Leading Indicator) Global real M1 suggests that 2021 could be a good year for risky assets. Image: Nordea and Macrobond
Total Returns – Gold, Nasdaq and MSCI World ex-US With the Nasdaq at all-time high, markets expect a weak global growth, low inflation and a strong U.S. dollar. Image: Gavekal, Macrobond
U.S. Tech and Global Markets – Nasdaq Composite vs. MSCI World ex. U.S. This chart shows the dominance of U.S. tech companies in global markets, as the Nasdaq has grown bigger than the rest of the world’s stock market. Image: Goldman Sachs Global Investment Research
G4 Central Bank Balance Sheet as % of GDP and MSCI World Index G4 central bank balance sheet (Fed, ECB, BoJ, BoE) as % of GDP is expanding. Image: Jeroen Blokland