Bank Loan Flows
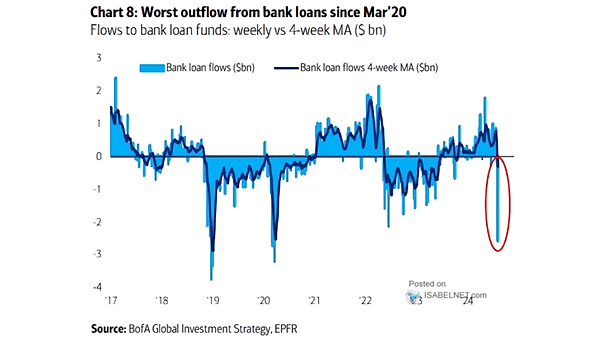
Bank Loan Flows The largest outflow from bank loan funds since March 2020 can be seen as a negative development and reflects negative investor sentiment. Image: BofA Global Investment Strategy
Bank Loan Flows The largest outflow from bank loan funds since March 2020 can be seen as a negative development and reflects negative investor sentiment. Image: BofA Global Investment Strategy
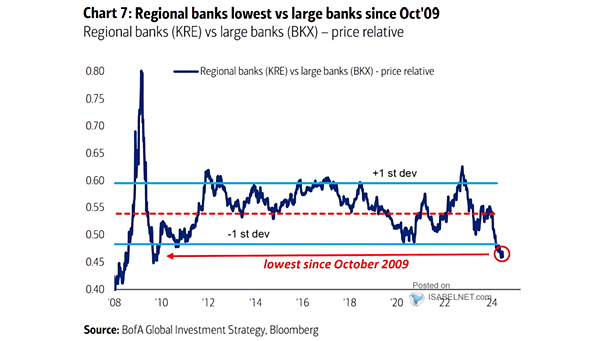
Performance – Regional Banks vs. Large Banks Would investors be better served by focusing on quality large bank names rather than trying to find value in the regional banking sector at this time? Image: BofA Global Investment Strategy

Performance – S&P Regional Banks Index vs. S&P 500 Regional banks and the equal-weighted S&P 500 have recently reached new relative lows, a concerning trend in the financial market. This trend is noteworthy given the recent S&P 500 performance. Image: Morgan Stanley Research
Interest Rates – Central Bank Policy Rate Hikes vs. Cuts Emerging market central banks typically take the lead in initiating monetary tightening and easing cycles. In 2024, their approach has shifted away from aggressive easing. Image: BofA Global Investment Strategy
Tech Stocks – G3 Central Bank Balance Sheet vs. Nasdaq 100 Will the divergence between central bank liquidity and tech stock performance continue through 2024? Image: BofA Global Investment Strategy
Central Banks – Global Monetary Policy Stimulus Leads Global Manufacturing PMI As global monetary policy stimulus tends to lead global manufacturing PMI by 8 months, could this signal the end of the economic slowdown? Image: Topdown Charts
U.S. Bank Reserves as a Percent of GDP As bank reserves relative to GDP gradually return to normal levels, they will no longer contribute to the upward momentum of equity valuation multiples. Image: Morgan Stanley Wealth Management
Liquidity Policies and Central Bank Balance Sheets Central banks have barely decreased the amount of QE stock, suggesting a deliberate and measured strategy in scaling back economic support. Image: BofA Global Investment Strategy
Time Series of the S&P 500, Highlighting Periods of Stress and Response from Central Banks Post the 2013 Taper Tantrum, the interventions by central banks during market dips provided buying opportunities for investors to generate excess returns, rather than reasons to panic or sell off their investments. Image: BofA Global Research
Number of Global Central Bank Hikes and Cuts The current trend of global central banks cutting interest rates at the fastest pace since August 2020 could significantly impact financial markets, borrowing costs, and overall economic activity. Image: Deutsche Bank
Banks vs. S&P 500, Relative Price Performance U.S. banks are experiencing their lowest performance relative to the S&P 500 in the past 80 years. Image: BofA Global Investment Strategy