Fear & Greed Index vs. S&P 500 Index
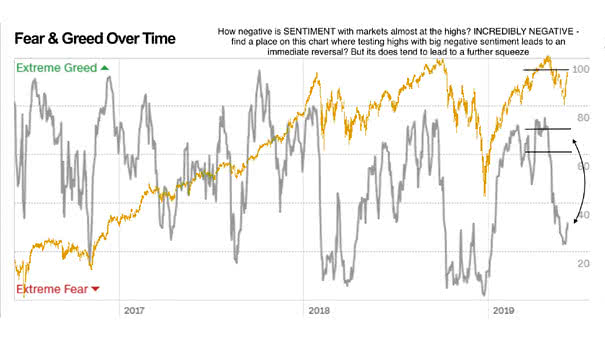
Fear & Greed Index vs. S&P 500 Index This chart shows how optimism stays unusually low. Is this alarming for bears? Image: Cable News Network
Fear & Greed Index vs. S&P 500 Index This chart shows how optimism stays unusually low. Is this alarming for bears? Image: Cable News Network
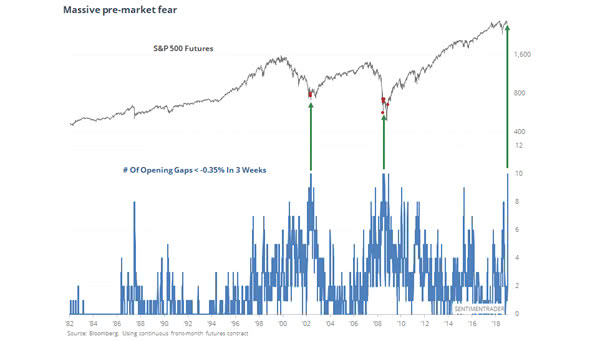
S&P 500 Futures – Massive Pre-market Fear Since 1982 Since 1982, there have been two time periods of this massive pre-market fear: in 2002 and 2008, during the bear market. Image: Sentimentrader

As China Trade Fears Intensified, Big U.S. Companies Tightened Spending A drop in capital spending in S&P 500 companies is a bad sign for the U.S. economy. Image: The Wall Street Journal
Investing Like Sheep (w/ Jeff Gundlach) | Future Fears “People want to be told what to think. I don’t! People need to listen with the mind as well as their ears, and not just repeat what they heard.” – Jeffrey Gundlach, founder and CEO of DoubleLine Capital. https://www.youtube.com/watch?v=QLf9tGq2Vv4
Thomas Russo: “Global Value Investing: Factors that I Most Fear and […]” Investing guru Thomas Russo speaks about global value investing and his long-term buy-and-hold strategy.https://www.youtube.com/watch?v=IzEvI1HOwN8
Average Percentile of Sentiment Indicators The post-Liberation Day environment reflects a strong rebound in investor confidence and a more bullish market stance, underpinned by easing tariff fears, trade deal progress, and supportive economic and technical factors. Image: Goldman Sachs Global Investment Research
Global Risk Sentiment Indicators Sentiment indicators suggest a “Goldilocks” scenario for risk appetite—investors are cautiously optimistic, but not exuberant or fearful. Image: TS Lombard
S&P 500 Index The market’s ongoing volatility is a direct response to the unpredictable cycle of tariff announcements, pauses, and retaliations, with sentiment swinging between hope for de-escalation and fear of economic damage. Image: Deutsche Bank Asset Allocation
S&P 500 Target for 2025 In the coming months, robust earnings, a weaker dollar, anticipated Fed rate cuts, and easing recession fears are expected to make U.S. equities a key driver of the global equity rally. Image: Bloomberg
U.S. High Yield Credit Spreads and Recessions U.S. high-yield credit spreads in May 2025 show little evidence of recession fears, remaining well below the levels seen during previous downturns. Image: Deutsche Bank
Google Searches for “Global Financial Crisis” and “Great Recession” While fears of a 2025 tariff-driven recession evoke memories of 2008, some investors see today’s prevailing pessimism as a contrarian bullish signal for stocks. Historically, extreme bearish sentiment has often marked market bottoms. Image: CNBC