Copper to Gold Ratio
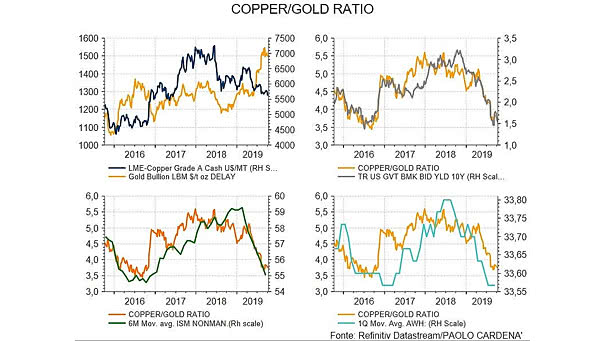
Copper to Gold Ratio The copper to gold ratio provides useful information on the evolution of the U.S. 10-year Treasury, the ISM Non-Manufacturing Index and the average weekly hours worked. Image: Paolo Cardena
Copper to Gold Ratio The copper to gold ratio provides useful information on the evolution of the U.S. 10-year Treasury, the ISM Non-Manufacturing Index and the average weekly hours worked. Image: Paolo Cardena
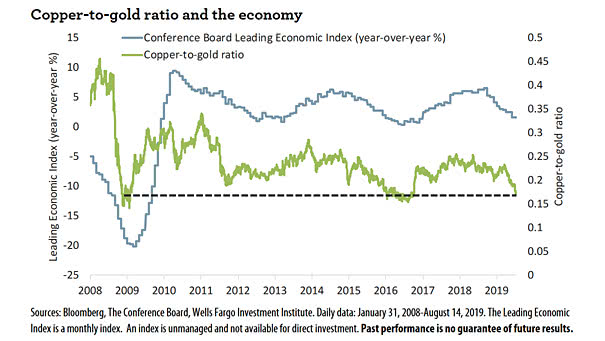
Copper to Gold Ratio and Conference Board Leading Economic Index (LEI) When the copper-to-gold ratio decreases, it is an early warning signal for the economy, meaning that growth optimism is fading. Image: Wells Fargo Investment Institute

Copper to Gold Ratio and U.S. 10-Year Treasury Yield The chart suggests that the correlation between the copper/gold ratio and the US 10-year Treasury yield is still valid. Image: Nordea and Macrobond
U.S. 10-Year Yields vs. Copper To Gold Ratio Great chart showing a strong correlation between U.S. 10-year yields and the copper to gold ratio. Image: Nordea and Macrobond
Gold/CPI Ratio The inflation-adjusted price of gold has reached a new high, breaking its previous record from January 1980. This reflects the ongoing devaluation of the U.S. dollar, global economic uncertainties, and strong demand from central banks. Image: Bloomberg
Gold-to-Copper Price Ratio The gold-to-copper price ratio is currently far from a level of complacency. Image: J.P. Morgan
Gold to Silver Ratio The gold to silver ratio is an interesting indicator at its extremes. Image: Morgan Stanley Research
Ratio of 3-Month to 6-Month Realized Volatilities for Bitcoin vs. the Corresponding Volatilities for Gold According to J.P. Morgan, the current fair value for Bitcoin based on a volatility ratio of Bitcoin to gold is US$23,000. Image: J.P. Morgan
Gold to Copper Ratio The gold-to-copper ratio is a reliable barometer of global economic health. Image: Alpine Macro
Twin Deficits vs. Gold-to-S&P 500 Ratio U.S. twin deficits suggest that gold could outperform the S&P 500. Image: Crescat Capital LLC
Gold to Oil Ratio 1860-2020 The gold to oil ratio has reached the highest levels on record. Is oil a buying opportunity? Image: Goehring & Rozencwajg