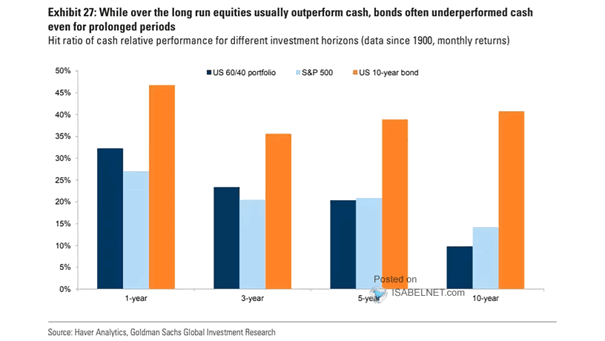
Hit Ratio of Cash Relative Performance for Different Investment Horizons
Hit Ratio of Cash Relative Performance for Different Investment Horizons Will bonds underperform cash? Image: Goldman Sachs Global Investment Research
Hit Ratio of Cash Relative Performance for Different Investment Horizons Will bonds underperform cash? Image: Goldman Sachs Global Investment Research
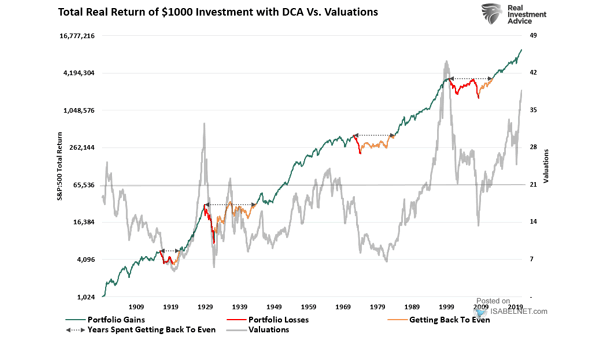
Total Real Return of $1000 Investment with Dollar Cost Average vs. S&P 500 Valuations Diversification does not always work and valuations matter. The S&P 500 can take a very long time to recover from a bear market. Image: Real Investment Advice

U.S. Net International Investment Position (NIIP) as a Share of GDP Is the U.S. net international investment position (NIIP) a cause of concern? Image: Gavekal, Macrobond
S&P 500 and Investment Grade Bonds The divergence between investment grade bonds and the S&P 500 tends to be a bearish signal for the S&P 500. Image: BofA Global Research
Median Forward S&P 500 Return Based on ISM Manufacturing Index at Time of Investment When the ISM is above 60, like today, the median forward return on the S&P 500 tends to be negative over the next 3 months. Image: Goldman Sachs Global Investment Research
Average Forward S&P 500 Return Conditional on ISM Manufacturing Index at Time of Investment When the ISM is above 60, like today, the return on the S&P 500 tends to be negative over the next 3 and 6 months. Image: Goldman Sachs Global Investment Research
Investment Banking Underwriting and Advisory Fees by Division Global banks generated a record $124.5bn in fees in 2020, as companies scrambled to raise money to survive the coronavirus pandemic. Image: Financial Times
Public Investment and GDP During times of uncertainty, such as the current period, public investment is most effective. Image: BofA Research Investment Committee
S&P 500 vs. Investment Grade Spread Will the gap close between the S&P 500 and the IG spread? Image: Credit Suisse
Gold Investment Physical Ex-Central Banks and Indices, of Equity Markets How much gold should an investor have in his investment portfolio? BofA suggests an optimized allocation to gold of approximately 4.5%. Image: BofA Global Research
S&P 500 Cumulative Price Return vs. Model Based Solely on Investment Flows and Market Liquidity The analysis from Goldman Sachs suggests that the S&P 500 has underperformed liquidity-adjusted investment flows. Image: Goldman Sachs Global Investment Research