Valuation – S&P 500’s CAPE Ratio and U.S. GDP Growth
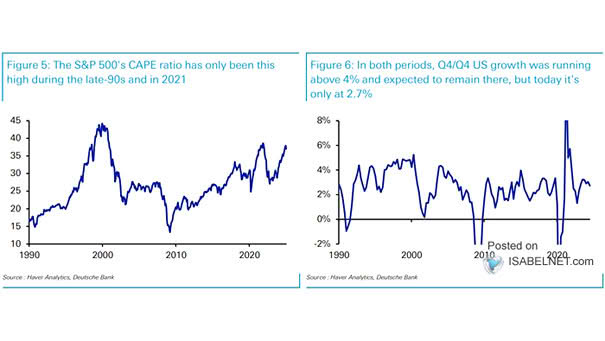
Valuation – S&P 500’s CAPE Ratio and U.S. GDP Growth The S&P 500’s CAPE ratio is currently high relative to U.S. GDP growth, potentially indicating lower expected returns in the future. Image: Deutsche Bank