Inequality – Concentration of Stock Ownership by Wealth Class in the U.S.
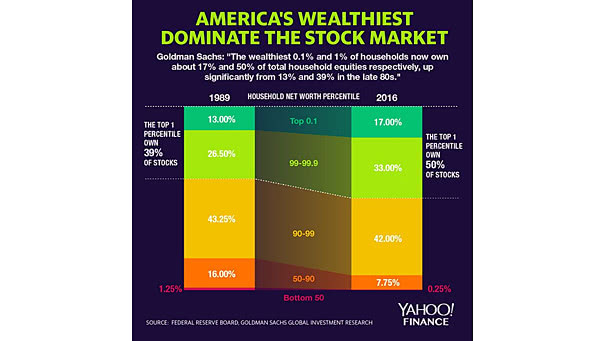
Inequality – Concentration of Stock Ownership by Wealth Class in the U.S. The top 1% own 50% of stocks held by American households. Image: Yahoo! Finance
Inequality – Concentration of Stock Ownership by Wealth Class in the U.S. The top 1% own 50% of stocks held by American households. Image: Yahoo! Finance
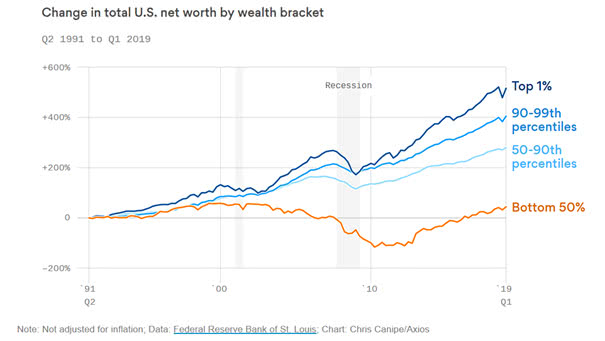
U.S. Net Worth by Wealth Bracket Another chart showing the wealth disparities before and after the Great Recession. Inequality: you may also like “Lower Incomes Paid the Highest Price.” Image: Axios

The Poorest and Wealthiest County in Every U.S. State This graphic shows that there is wide disparity between rich and poor counties. Picture Source: Visual Capitalist
The Top Wealthiest Countries in 2018 The United States is the world’s largest wealth market with $60.7 trillion in 2018. Inequality: you may also like “Lower Incomes Paid the Highest Price.” Image: Visual Capitalist
The 10% Richest Households in the U.S. Own Almost 70% of All Wealth The 10% richest households in the US used to own 60% of all wealth. Now they own almost 70%. Inequality: you may also like “U.S. Net Worth by Wealth Bracket.” Image: Deutsche Bank Global Research
Concentration of Stock Ownership by Wealth Bracket As the chart shows, the top 20% wealthiest American households own over 93% of stocks. You may also like “How the Composition of Wealth Changes from the Middle Class to The Ultra Rich?” and “U.S. Net Worth by Wealth Bracket.” Image: Visual Capitalist
How the Composition of Wealth Changes from the Middle Class to The Ultra Rich? From the middle class to the ultra rich, the composition of household wealth changes dramatically. Inequality: you may also like “U.S. Net Worth by Wealth Bracket.” Image: Visual Capitalist
U.S. Household Net Worth as % of Disposal Personal Income In the U.S., the household net worth-to-income ratio is nearing historic highs, driven mainly by soaring stock and home values. Yet, wealth gains from the AI boom have largely favored the richest, intensifying the wealth gap. Image: Deutsche Bank
U.S. Households’ Allocation to Equity, Bond and Cash Americans’ love for stocks has driven household equity allocations to historic highs, increasing wealth but also sparking concerns about market stability and the risks of shifting investor sentiment. Image: Goldman Sachs Global Investment Research
Contributions to Annualized U.S. PCE Growth The U.S. stock market’s recent underperformance is expected to reduce the wealth effect, turning it from a boost to a drag on consumption and increasing the risk of a broader economic slowdown as consumer spending weakens. Image: Goldman Sachs Global Investment Research
Ownership Breakdown of the U.S. Equity Market (Share of Corporate Equity Market) U.S. households own 38% of the U.S. equity market, demonstrating strong confidence in stocks. However, stock ownership is highly concentrated, with the wealthiest 10% holding approximately 90% of all household-owned equities. Image: Goldman Sachs Global Investment Research