Breakdown of U.S. Households’ Equity Ownership
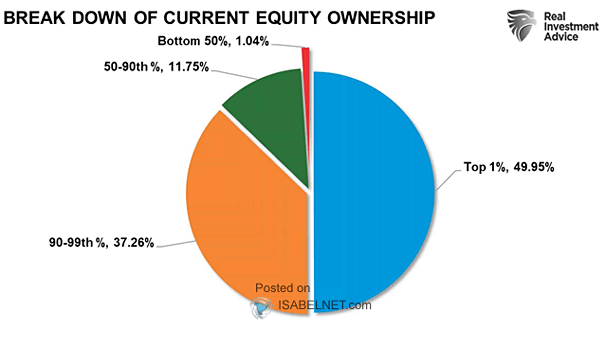
Breakdown of U.S. Households’ Equity Ownership In the United States, stock ownership is heavily concentrated among the wealthiest households. Recent data indicates that the top 10% of American households own approximately 90% of all stock market wealth. Image: Real Investment Advice