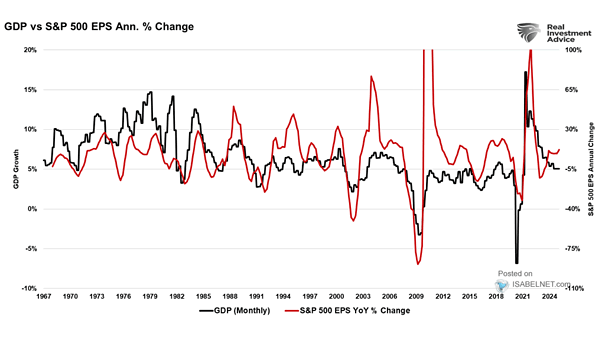
U.S. GDP vs. S&P 500 EPS
U.S. GDP vs. S&P 500 EPS The strong correlation between GDP growth and S&P 500 EPS underscores the importance of cautious investment strategies, particularly given current high market valuations and optimistic earnings forecasts. Image: Real Investment Advice