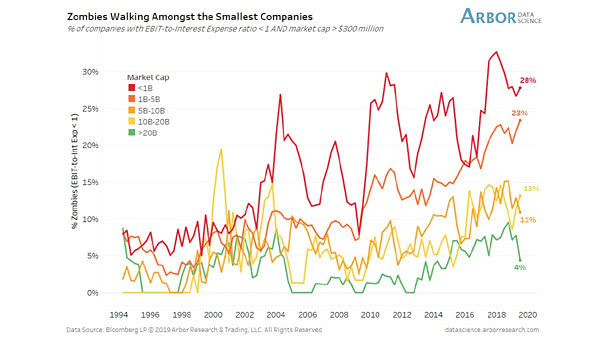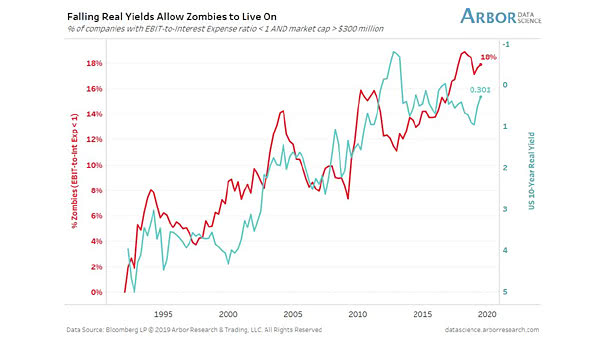
Falling Real Yields Allow Zombie Companies to Live On
Falling Real Yields Allow Zombie Companies to Live On The cost of extended monetary easing: the percentage of zombie companies continues to rise as U.S. 10-year real yields fall. Image: Arbor Research & Trading LLC