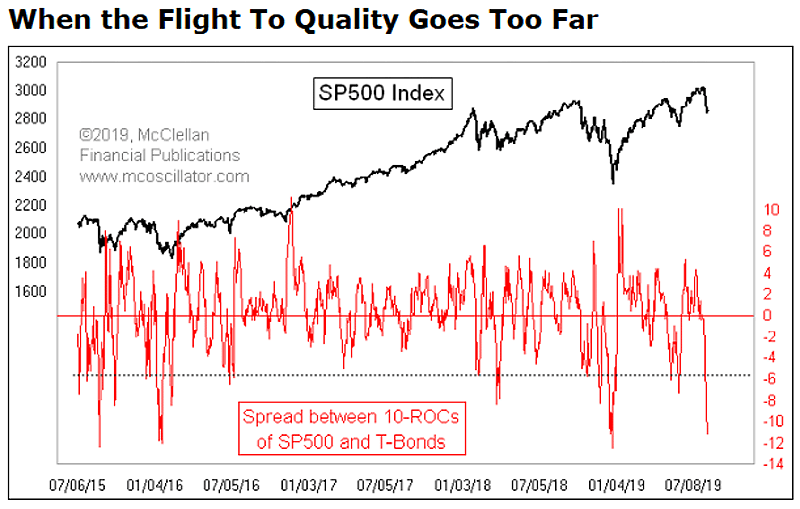
Aug 08 2019 Off Spread Between 10-ROC of S&P 500 and Treasury Bonds This interesting chart shows a 10 trading day rate-of-change (ROC) for the SP500 and for near-month Treasury bond futures prices. A price low is forming now.Image: McClellan Financial Publications, Inc.