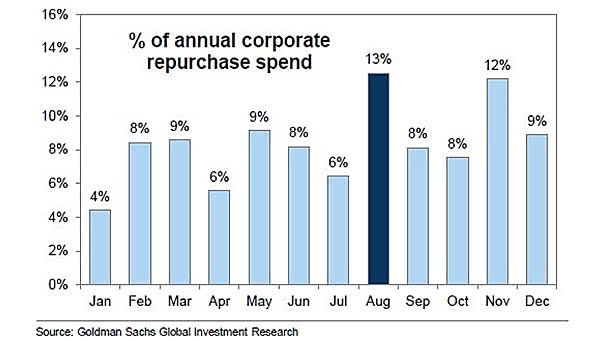
Share Buybacks by Month
Share Buybacks by Month Excluding 2008, August and November are generally the busiest months for buyback executions in the past decade. Image: Goldman Sachs Global Investment Research
Share Buybacks by Month Excluding 2008, August and November are generally the busiest months for buyback executions in the past decade. Image: Goldman Sachs Global Investment Research
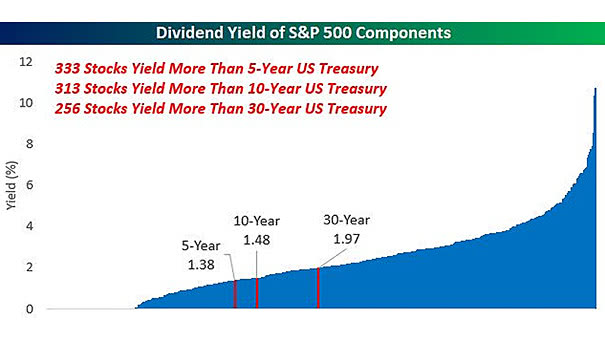
Dividend Yield of S&P 500 Components Yields on equities seem competitive vs. U.S. Treasuries, but equity risk does not disappear because a company pays a dividend. Image: Bespoke Investment Group

Estimated Tariff Impact on Core Inflation President Trump’s decision to increase the tariff rate will lead to a greater boost to U.S. consumer prices. Image: Goldman Sachs Global Investment Research
S&P 500 Forecast for 2019 Goldman Sachs is holding its year-end price-target for the S&P 500 at 3100, and its downside scenario at 2620 (as of August 23, 2019). Image: Goldman Sachs Global Investment Research
One of the Best Recession Indicator The Fed is cutting rates and the 10-year rate is inverted to Fed funds. Image: Real Investment Advice
Trade War and Financial Conditions Index The trade war has tightened the Goldman Sachs FCI by about 60bp cumulatively. The Goldman Sachs Financial Conditions Index (FCI) is a weighted sum of a long-term corporate yield, a short-term bond yield, the exchange rate, and a stock market variable. Image: Goldman Sachs Global Investment Research
Copper to Gold Ratio and Conference Board Leading Economic Index (LEI) When the copper-to-gold ratio decreases, it is an early warning signal for the economy, meaning that growth optimism is fading. Image: Wells Fargo Investment Institute
Fed Dovish Pivot – Stimulus Hopes Support Risk Appetite Growth sentiment appears to be stabilizing, due to optimism about fiscal policy. Image: Goldman Sachs Global Investment Research
Earnings, Margins and Valuation Considering earnings growth, operating margin and valuation, the S&P 500 should remain under pressure until Q3 earnings season. Image: Fidelity Investments
Effect of the Trade War on U.S. Real GDP Growth Assuming no further escalation, the trade war drag on U.S. growth is expected to peak at about -0.4% in the second half of 2019. Image: Goldman Sachs Global Investment Research
Different Holders of DM Government Debt The chart shows the historical breakdown of different holders of DM government bonds and overall DM debt-to-GDP. Even with QE, central bank government bond holdings are below historical peaks. Image: BlackRock Investment Institute