Inflows to Equities vs. Allocations to Equities
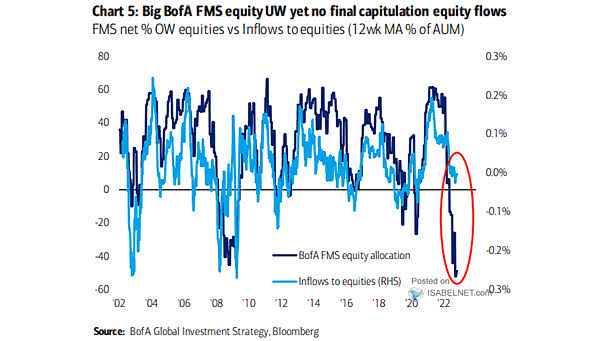
Inflows to Equities vs. Allocations to Equities Despite the fact that FMS investors are very bearish equities, there is no capitulation yet. Image: BofA Global Investment Strategy
Inflows to Equities vs. Allocations to Equities Despite the fact that FMS investors are very bearish equities, there is no capitulation yet. Image: BofA Global Investment Strategy
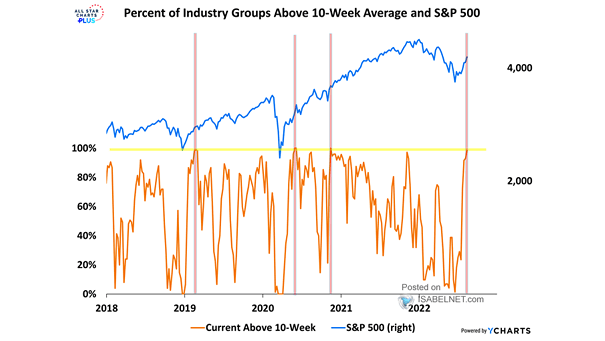
Percent of Industry Groups Above 10-Week Average and S&P 500 Is the current rally in U.S. equities more than just a bear market bounce, as 99% of industry groups are above their 10-week average? Image: All Star Charts

U.S. Net Equity Future Positions of Asset Managers and Drawdown > 10% When will the U.S. equity bear market be over? Image: Goldman Sachs Global Investment Research
Fed and Dow Jones Industrial Average Is the bear market far from over as recession risks mount? Image: BofA Global Investment Strategy
Stock Market Strength vs. Volatility 2022 starts to smell like 2008. Are U.S. stocks in a secular bear market? Image: Willie Delwiche
MSCI All Country World Index and Global Pairwise Stock Correlations The bear market bottom is probably not yet in, as stock correlation is higher at global market bottoms. Image: Morgan Stanley Wealth Management
Philadelphia Fed Survey vs. S&P 500 Earnings Growth Rate The bear market bottom is probably not yet in as the Philly Fed survey suggests an earnings recession is highly likely. Image: Real Investment Advice
S&P 500 Following Sentiment Extremes The latest AAII U.S. investor sentiment bull – bear spread suggests promising S&P 500 returns over the next few months. Image: Richardson Wealth
Commodities Breadth Tapering After a historic two years, should investors be bearish on commodities right now? Image: Topdown Charts
Gold vs. Long-Term Treasuries Rising yields tend to be bearish for gold. Image: Morgan Stanley Wealth Management
European Stocks – Stoxx 600 Should investors be bearish on European equities? Image: BofA Global Research