Gold vs. Long-Term Treasuries
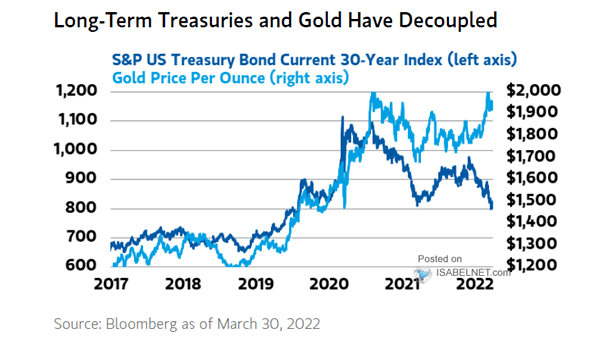
Gold vs. Long-Term Treasuries Rising yields tend to be bearish for gold. Image: Morgan Stanley Wealth Management
Gold vs. Long-Term Treasuries Rising yields tend to be bearish for gold. Image: Morgan Stanley Wealth Management
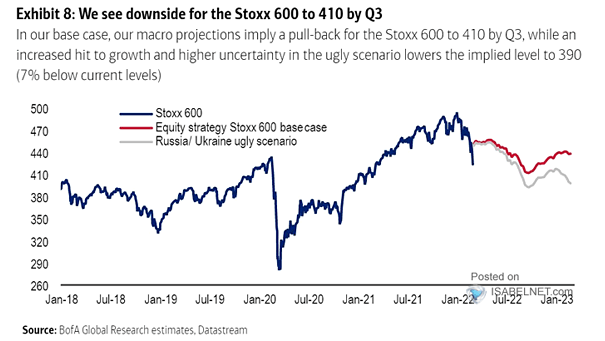
European Stocks – Stoxx 600 Should investors be bearish on European equities? Image: BofA Global Research

S&P 500 Index vs. Commodities The sharp rise in commodity prices could be bearish for U.S. stocks. Image: Real Investment Advice
European Stocks – Euro Area M1 Momentum vs. Euro Area PMI Momentum Should investors be bearish on European stocks? Image: BofA Global Research
Global Equity Markets – MSCI ACWI Index with HY/IG Flows BofA sees a rates shock this year and remains bearish on equities and credit. Image: BofA Global Investment Strategy
U.S. Dollar Index vs. Commodities A strong U.S. dollar tends to be bearish for commodities. Image: Real Investment Advice
Markets – Equity Risk Premium and Real 10-Year U.S. Treasury Yield The similarities between today and the tech bubble make BofA bearish on 2022. Image: BofA US Equity & Quant Strategy
S&P 500 Index Returns and Santa Claus Rally Historically, a bearish Santa Claus rally does not tend to bode well for January and the full year. Image: LPL Research
S&P 500 Real Earnings Yield Is the S&P 500 real earnings yield bearish for the U.S. stock market? Image: The Daily Shot
Markets – Investment Clock The investment clock is in the bear flattening phase. Image: BofA Global Research
S&P 500 Consensus Long-Term Growth Forecast The S&P 500 consensus long-term growth is at record high. Is this a bearish signal? Image: BofA US Equity & Quant Strategy