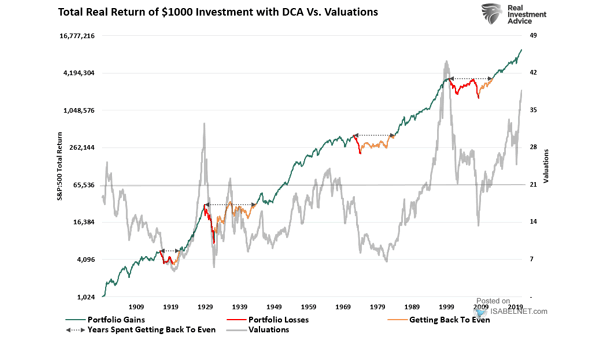
Bitcoin Trend Line

Bitcoin Trend Line Bitcoin price chart turns bearish. Image: Bloomberg

S&P 500 and Investment Grade Bonds

S&P 500 and Investment Grade Bonds The divergence between investment grade bonds and the S&P 500 tends to be a bearish signal for the S&P 500. Image: BofA Global Research

Inflation – S&P 500 and the CPI YoY Index

Inflation – S&P 500 and the CPI YoY Index The secular chart could suggest a late 1950s pattern. Rising inflation is not necessarily bearish for the S&P 500. Image: BofA Global Research Click the Image to Enlarge

Sentiment – 25-Day U.S. Put/Call Ratio

Sentiment – 25-Day U.S. Put/Call Ratio Bearish seasonality risk is increasing, as the 25-day put/call ratio is trading at relatively low levels. Image: BofA