S&P 500 Around First Fed Rate Hikes vs. Speed of Hikes
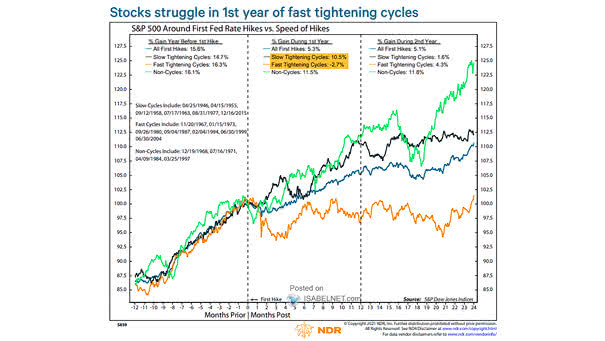
S&P 500 Around First Fed Rate Hikes vs. Speed of Hikes Historically, the S&P 500 has tended to struggle in the first year of fast tightening cycles. Image: Ned Davis Research
S&P 500 Around First Fed Rate Hikes vs. Speed of Hikes Historically, the S&P 500 has tended to struggle in the first year of fast tightening cycles. Image: Ned Davis Research
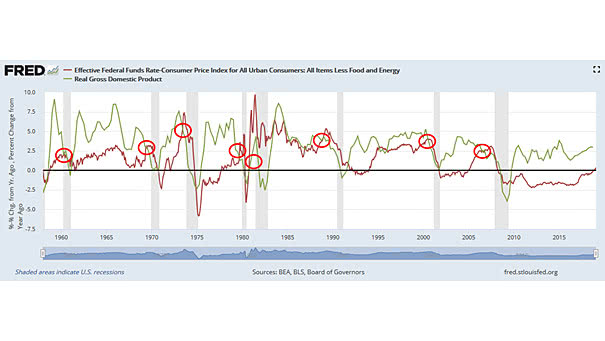
Real GDP vs. Real Fed Funds Rate One of our most favorite charts is the real GDP vs. the real Fed funds rate (adjusted for inflation). Historically, recessions begin when the real Fed Funds rate exceeds GDP growth. We are far from that today. So, this cycle should not end any time soon. Real Fed…

Real Fed Funds Rate Real Fed funds rate is a key indicative factor, because it’s a very good measure of how tight or loose monetary policy is. Real Fed funds rate is the “true cost” of borrowing money. Recessions have always been preceded by a substantial tightening of monetary policy, which, in real terms, matter…
U.S. 10-Year Yields and Peak in U.S. 2-Year Yields Will U.S. Treasury yields peak once the Fed finishes tightening? Image: Goldman Sachs Global Investment Research
2Y-10Y U.S. Treasury Yield Curve vs 3M-10Y U.S. Treasury Yield Curve The steepening of the 3-month/10-year U.S. Treasury yield curve suggests that the Fed’s monetary policy tightening could be slower. Image: Morgan Stanley Wealth Management
S&P 500 Index vs. Global M1 Liquidity Another good correlation between the S&P 500 Index and global M1 liquidity, while the Fed plans to stop quantitative tightening. The money supply M1 is the amount of effective money in the economy. Image: Nordea and Macrobond