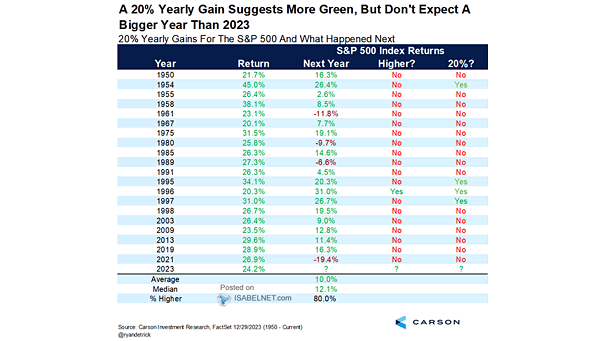
20% Yearly Gains for the S&P 500 Index and What Happened Next
20% Yearly Gains for the S&P 500 Index and What Happened Next A significant annual gain of 20% in the S&P 500 index is often indicative of continued positive performance in the following year, with a median return of 12.1% seen a year later since 1950. Image: Carson Investment Research