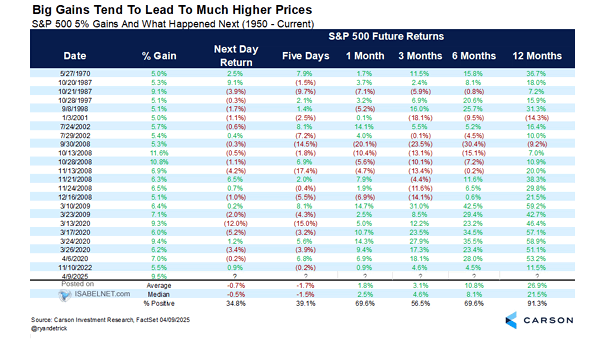
S&P 500 5% Gains and What Happened Next
S&P 500 5% Gains and What Happened Next Since 1950, the S&P 500 has surged 5% or more in a single day on 23 occasions. A year later, stocks climbed an average of 26.9%, with positive returns in over 91% of cases—good news for bulls! Image: Carson Investment Research