Performance – S&P 500 1% Gains
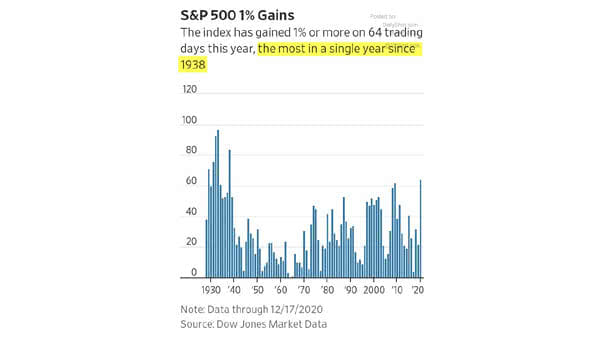
Performance – S&P 500 1% Gains The S&P 500 index has gained 1% or more on 64 trading days in 2020. This is a record since 1938. Image: The Wall Street Journal
Performance – S&P 500 1% Gains The S&P 500 index has gained 1% or more on 64 trading days in 2020. This is a record since 1938. Image: The Wall Street Journal
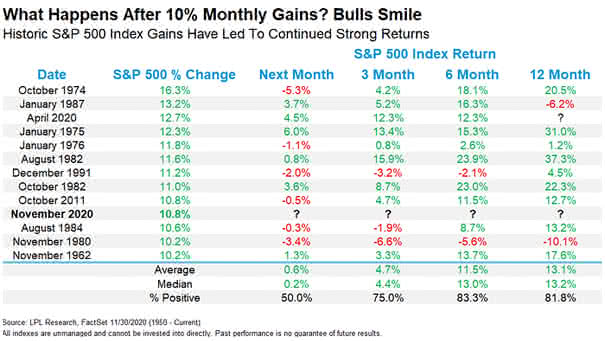
S&P 500 Returns – What Happens After 10% Monthly Gains? Historically, after 10% monthly gains, the S&P 500 tends to be positive over 6 and 12 months. Image: LPL Research

Number of S&P 500 Stocks Contributing to Market Gains in 2020 464 stocks in the S&P 500 closed positively in November. Will the trend continue in December? Image: Statista
Performance – S&P 500 and Largest 20-Day Gains Ever Historically, past big 20-day rallies saw the S&P 500 higher 6- and 12-months later. Image: LPL Research
Returns – S&P 500 Is on Pace for Its Fifth Consecutive Month of Gains Does the U.S. stock market rally have more legs, even though valuations are high? Image: Bloomberg
Quarterly Gain >15% and S&P 500 Index Return Big quarterly gains (>15%) tend to see continued strength. Image: LPL Research
S&P 500 and Largest 50-Day Gains Ever (Greater than 20%) This was the greatest 50-day rally ever for the S&P 500. Historically, past big rallies saw the S&P 500 higher 6- and 12-months later. Image: LPL Research
S&P 500 and 10% Monthly Gains, What Happens Next? Historically, 10% monthly gains for the S&P 500 have led to continued strong returns. Image: LPL Research
S&P 500 Largest One Day Gains 1928 – 2020 The largest daily gains in the S&P 500 tend to occur during secular bear markets. Image: Bespoke Investment Group
S&P 500 Return Gains and Recent U.S. Recessions This chart shows the S&P 500 return gains after most recent U.S. recessions. Image: Statista
S&P 500 Total Returns in Years After 30%-plus Gains Since 1950, when the S&P 500 Total Return has been up more than 30%, it was up nearly 15% on average in the following year and the U.S. economy rarely has fallen into recession. Image: LPL Research