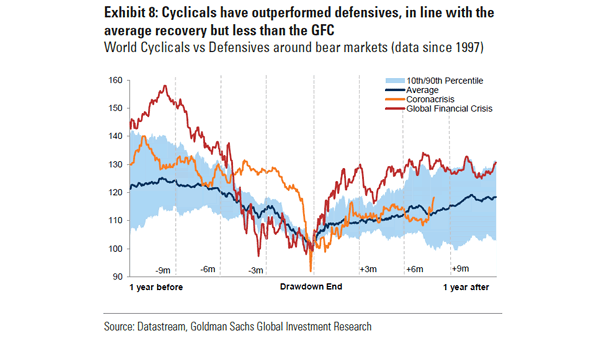
Cyclical Stocks – World Cyclicals vs. Defensives Around Bear Markets
Cyclical Stocks – World Cyclicals vs. Defensives Around Bear Markets Cyclicals have recovered vs. defensives, in line with the average recovery, but they have lagged the post-GFC recovery. Image: Goldman Sachs Global Investment Research