Elections – U.S. Voting Age Population
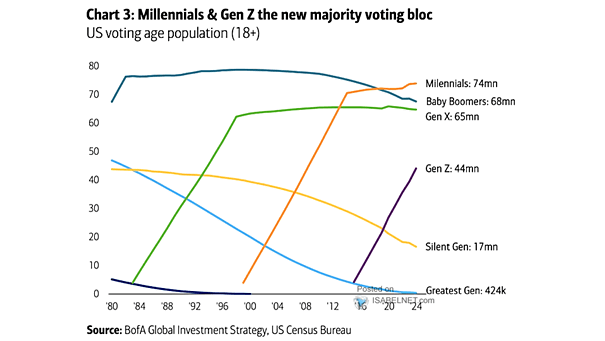
Elections – U.S. Voting Age Population Younger generations, specifically Millennials and Generation Z, are projected to become the new majority voting bloc in the upcoming 2024 U.S. presidential election, marking a significant generational shift in the electorate. Image: BofA Global Investment Strategy