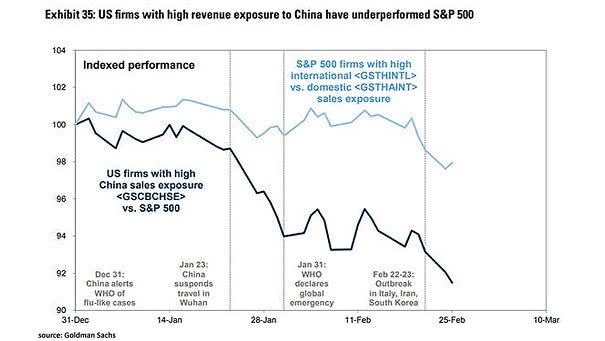
Info Tech Stocks and Sales Exposure to Greater China
Info Tech Stocks and Sales Exposure to Greater China Stocks in the information technology sector have the most sales exposure to Greater China. Image: Goldman Sachs Global Investment Research
Bottom-Up Consensus Forecast of S&P 500 YoY Sales Growth Chart showing the bottom-up consensus forecast of S&P 500 year-over-year sales growth. Image: Goldman Sachs Global Investment Research
Gold Price and Central Bank Gold Sales & Purchases Chart suggesting that gold purchases from central banks have contributed to the rise in gold prices. An R² of 0.85 (since 2004) is quite high and significant. Image: BofA Merrill Lynch Global Research
10-Year Rolling Average Sales Growth by Region The importance of remembering the past: this chart shows the steep decline in sales growth over time. Image: Goldman Sachs Global Investment Research
U.S. Stocks with High China Sales and China Stocks with High U.S. Sales US-China trade war affects the relative performance of U.S. and China stocks vs. local market. Image: Goldman Sachs Global Investment Research
U.S. Stocks with High China Sales vs. S&P 500 US-China trade war affects the relative performance of U.S. stocks with high China sales vs. the S&P 500 index. Image: Goldman Sachs Global Investment Research
World Semiconductor Sales and S&P 500 EPS Tight relationship between world semiconductor sales and S&P 500 earnings per share. You may also like “Semiconductor Sales vs. Global Earnings per Share.” Image: Oxford Economics
American Semiconductor Sales Lead ISM Manufacturing Index by 3 Months This chart shows that the downtrend in American semiconductor sales is currently worrying. You may also like “ISM Manufacturing Index vs. S&P 500 Index since 2011.” Image: Deutsche Bank Global Research