FMS Investors and Stock Market Valuation
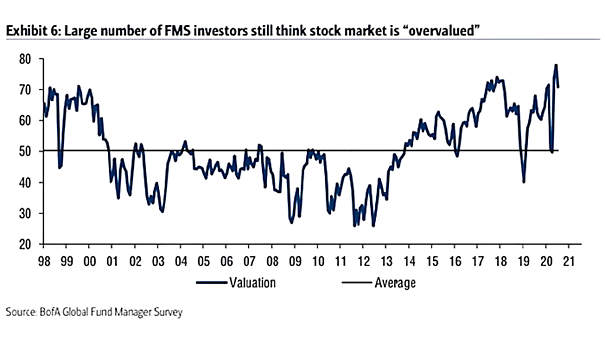
FMS Investors and Stock Market Valuation Is the stock market overvalued? Large number of FMS investors still think stock market is “overvalued” at 71%. Image: BofA Global Fund Manager Survey
FMS Investors and Stock Market Valuation Is the stock market overvalued? Large number of FMS investors still think stock market is “overvalued” at 71%. Image: BofA Global Fund Manager Survey
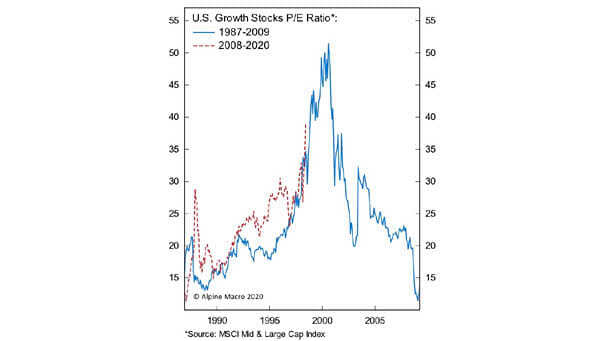
U.S. Growth Stocks P/E Ratio: 1987-2009 vs. 2008-2020 Are growth stocks overvalued? This chart shows the P/E ratio on growth stocks during the dotcom bubble compared to the period 2008-2020. Image: Alpine Macro

Equity Over-Valuation Composite Indicator Is the current stock market the most overvalued since 1998? 78% of FMS investors think so. Image: BofA Global Fund Manager Survey
Valuation – U.S. 10-Year Treasury Yield vs. Fair Value Chart suggesting that U.S. 10-year Treasuries are extremely overvalued. Image: BCA Research
U.S. Dollar and the Big Mac Index The latest Big Mac index suggests that the U.S. dollar remains overvalued against most currencies. Image: The Economist
U.S. Stock Market – Valuation Metric Is the U.S. stock market overvalued? By historical standards, many traditional valuation metrics look expensive. Image: Charles Schwab
S&P 500 Valuation Metric Is the U.S. equity market overvalued? The S&P 500’s median valuation metric is in the 89th percentile. That’s not cheap by historical standards. Image: Goldman Sachs Global Investment Research
Global Valuation Map This chart shows global valuation estimates across various countries, and suggests that the U.S. stock market is overvalued by +4%. Image: Morningstar Research
U.S. Dollar – Trade-Weighted Real Exchange Rates Chart suggesting that the U.S. dollar looks overvalued against euro and sterling. Image: Gavekal, Macrobond
Cyclicals vs. S&P 500 Chart suggesting that cyclicals are not overvalued vs. S&P 500. Image: Goldman Sachs Global Investment Research
U.S. Long Term Nominal GDP Growth and U.S. 10-Year Bond Yield According to this chart, U.S. bonds are overvalued. Image: Topdown Charts