The Equity Risk Premium May Be Bullish

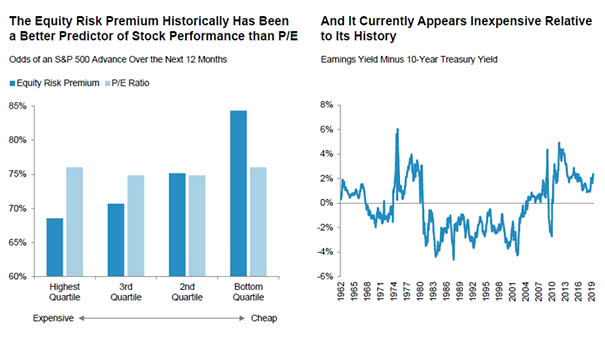
The Equity Risk Premium May Be Bullish The equity risk premium suggests that the S&P 500 is not overvalued, which may be a bullish signal. You may also like our “Stock Market Equity Risk Premium.” Image: Fidelity Management and Research

Stock Market Capitalization as a Percentage of Nominal GDP

Stock Market Capitalization as a Percentage of Nominal GDP This ratio is useful in determining whether the U.S. stock market is undervalued or overvalued relative to its historical average. The current reading is pretty high at 149.15%. You may also like the “Stock Market Valuation” and “S&P 500 Index – Earnings & Valuation.” Image: Bianco Research

S&P 500 Valuations Above Historical Average

S&P 500 Valuation Above Historical Average The S&P 500 is overvalued on 17 of 20 valuation metrics. You may also like our “Stock Market Valuation.” Image: Bank of America

The Gold to Oil Ratio since 2018

The Gold to Oil Ratio since 2018 When the gold to oil ratio approaches 30x, oil is undervalued. When the gold to oil ratio approaches 10x, gold is undervalued. Today, the gold-oil ratio is below 20x. So, neither oil nor gold is undervalued nor overvalued relative to each other. Image: Goehring & Rozencwajg

“U.S. Stock Market, No Froth In Sight” Says Stock Market Sentiment Index

“U.S. Stock Market, No Froth In Sight” Says Stock Market Sentiment Index Keep in mind that it is just another investor sentiment tool. But it does not show at all if the US stock market is overvalued or undervalued. See our stock market valuation model (99% correlation and R² = 0.97 since 1970).

The S&P 500 Hits All-Time High

The S&P 500 Hits All-Time High Bulls make money and are happy again… Yes, but until when? Keep in mind that the US stock market is currently overvalued by 9%. Image: Hedgeye Risk Management LLC

Was the US Stock Market Crash on October 19, 1987, a “Black Swan” Event?

Was the US Stock Market Crash on October 19, 1987, a “Black Swan” Event? A “Black Swan” is a metaphor that describes an event that comes as a surprise with a major effect, which is extremely difficult to predict. The theory was developed by Nassim Nicholas Taleb. The US stock market on October 19, 1987,…

Why the Stock Market Valuation Matters Before a Recession?

Why the Stock Market Valuation Matters Before a Recession? When the stock market is VERY overvalued before a recession, it tends to be VERY undervalued. Like the swing of a pendulum, or the stretching of a rubber band, sooner or later it comes back very violently. This happened in 1973, 2000 and 2008. The US…

Stock Market Long-Term Forecast

https://www.isabelnet.com/wp-content/uploads/2019/03/stock-market-long-term-forecast.mp4 This great long-term forecast model displays the annual and total return expected for the next 10 years with a high degree of confidence This advanced model makes a forecast for the next 12 months, next 3 years, next 5 years, and next 10 years, with dividends reinvested. For each period, it displays the annual…

Stock Market Short-Term Forecast

https://www.isabelnet.com/wp-content/uploads/2019/03/stock-market-short-term-forecast.mp4 This great tool shows the US stock market forecast for the next 12 months and the probability This advanced mathematical model extracts insights from multiple financial data and suggests a stock market short-term forecast for the next 12 months with a very high degree of confidence. This great prediction model is updated daily, with…