Net Buys by Size Segment
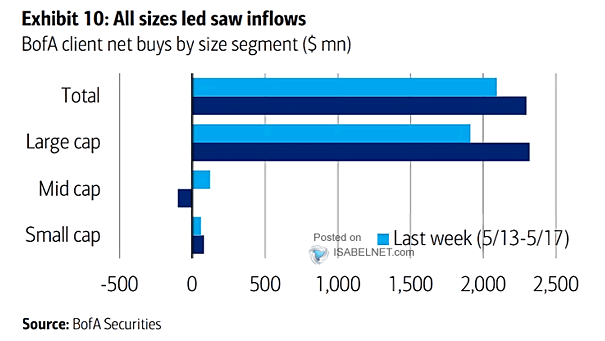
Net Buys by Size Segment Bofa’s clients maintain their preference for large-caps, while showing less interest in small-caps and mid-caps. Image: BofA Securities
Net Buys by Size Segment Bofa’s clients maintain their preference for large-caps, while showing less interest in small-caps and mid-caps. Image: BofA Securities
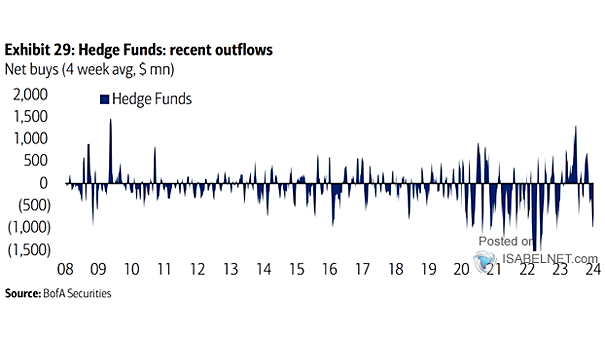
Equities – Hedge Fund Client Four Week Average Net Flows Last week, BofA’s hedge fund clients were net buyers of equities for the first time in 10 weeks. Image: BofA Securities

U.S. Equity Issuance Despite the improvement in macroeconomic conditions, the issuance of U.S. equity and equity-linked securities has been relatively weak this year. Image: Goldman Sachs Global Investment Research
U.S. Fixed Rate CMBS Index Price Commercial mortgage-backed securities prices are currently at their lowest since October 2009. Image: BofA Global Investment Strategy
Flow Seasonality by Month Historically, December and January are the two strongest months for equity inflows. Image: BofA Securities
Spread Between Rolling 8-Week Cumulative Flows as a % of Market Cap: Small Caps vs. Large Caps Should investors overweight U.S. small-cap stocks despite strong outflows? Image: BofA Securities
Flows – Fixed-Income Assets Flows into Treasury-Inflation Protected Securities (TIPS) funds have been very strong, as they offer investors protection against rising inflation. Image: BofA Global Research
Flows – Subsequent 4-Week S&P 500 Returns Retail investors continue to buy the dip despite the Russia-Ukraine conflict, which is bullish for U.S. stocks. Image: BofA Securities
Buybacks by Sector Stock buybacks are concentrated in the technology and financial sectors. Image: BofA Securities
Average Net Buying (Selling) of U.S. Single Stocks by Institutional and Private Clients Can tax-loss harvesting improve investor returns? Image: BofA Securities
ETF Flows – Equity ETF Net Buy by Sector Investors continue to put their money into the energy sector. Image: BofA Securities