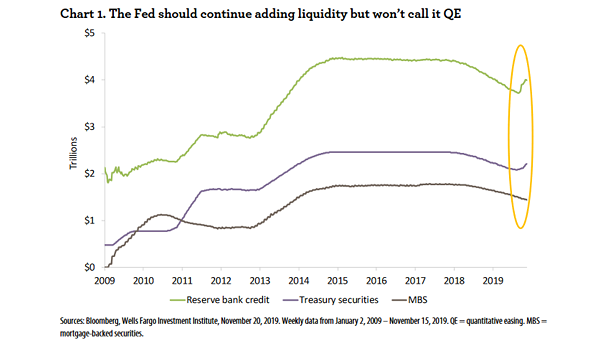
Reserve Bank Credit, Treasury Securities and MBS
Reserve Bank Credit, Treasury Securities and MBS This chart shows how Reserve Bank credit has increased, as the Fed has continued to add treasury securities to its balance sheet. Image: Wells Fargo Investment Institute