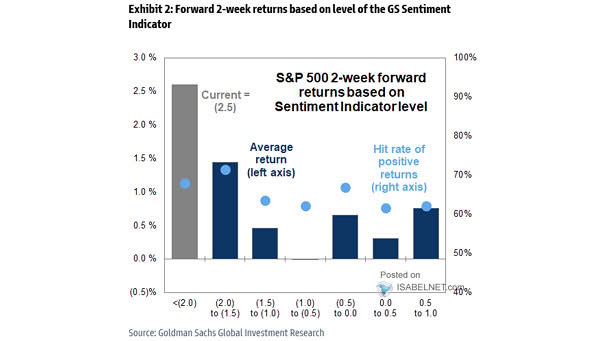
Sentiment – 5-Day Put/Call Volume Ratio

Sentiment – 5-Day Put/Call Volume Ratio The 5-day moving average of the put/call volume ratio has hit its lowest point since late 2021’s bull market peak. Sustained low readings in this ratio often indicate market tops and excessive optimism. Image: Deutsche Bank Asset Allocation

Sentiment – CBOE Equity Put/Call Ratio

Sentiment – CBOE Equity Put/Call Ratio The current U.S. equity put/call ratio indicates a broadly bullish sentiment, implying that investors are confident about the market’s future performance, for now. Image: The Daily Shot

Market Sentiment Indicator

Market Sentiment Indicator Morgan Stanley’s market sentiment indicator has recently turned positive, signaling a shift towards a risk-on appetite after maintaining a neutral stance. Image: Morgan Stanley Research

Sentiment – NFIB Small Business Optimism Index

Sentiment – NFIB Small Business Optimism Index In November, the NFIB Small Business Optimism Index increased by 8 points to 101.7, driven by the recent election results, potentially boosting employment, investment, and economic activity. Image: J.P. Morgan

Sentiment – U.S. Composite Put/Call Ratio

Sentiment – U.S. Composite Put/Call Ratio The sharp decline in the U.S. put/call ratio to very low levels signals widespread market complacency, as even typically anxious investors appear unworried. Image: Morgan Stanley Wealth Management

U.S. Equity Sentiment Indicator

U.S. Equity Sentiment Indicator With the year-end approaching, sentiment is overly stretched, implying that market participants might be excessively optimistic and overconfident in their bullish outlook. Image: Goldman Sachs Global Investment Research

U.S. Equity Sentiment Conditions Index

U.S. Equity Sentiment Conditions Index U.S. equity sentiment appears to be at relatively depressed levels heading into the 2024 U.S. presidential election, due to heightened uncertainty, market volatility, and concerns about potential policy shifts. Image: Pictet Asset Management

Sentiment – Global Equity Risk-Love

Sentiment – Global Equity Risk-Love The Global Equity Risk-Love indicator, currently at the 68th percentile, has moved out of the euphoria territory, allowing for potential upside as we approach year-end. Image: BofA Predictive Analytics

Sentiment – Global Risk Demand Index

Sentiment – Global Risk Demand Index The Morgan Stanley Global Risk Demand Index indicates that investors’ risk appetite is very low, which can often be seen as a contrarian indicator, where extreme pessimism might signal a potential rebound in equity markets. Image: Morgan Stanley

Sentiment Scores During Earnings Calls

Sentiment Scores During Earnings Calls In recent quarters, falling inflation and the prospect of lower interest rates have had a positive impact on U.S. corporate sentiment, which is seen as a favorable sign for the U.S. economy. Image: BofA US Equity & Quant Strategy

Sentiment – U.S. Put Call Ratio Composite

Sentiment – U.S. Put Call Ratio Composite A relatively low put/call ratio is often interpreted as a sign of heightened bullish sentiment or greed in the market, which is frequently viewed as a contrarian indicator. Image: The Daily Shot