S&P 500 Total Return Attribution
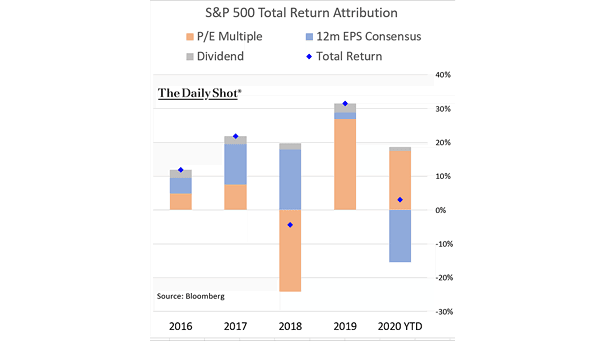
S&P 500 Total Return Attribution Multiple expansion explains the S&P 500’s total return YTD, despite negative earnings growth. Image: The Daily Shot
S&P 500 Total Return Attribution Multiple expansion explains the S&P 500’s total return YTD, despite negative earnings growth. Image: The Daily Shot
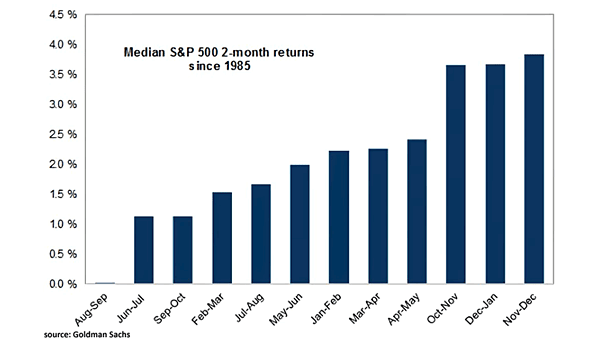
Seasonality – Median S&P 500 2-Month Returns since 1985 Since 1985, August and September have been the two worst months of the year for the S&P 500. Image: Goldman Sachs Global Investment Research

Top 5 vs. S&P 500 ex-Top 5 – YoY Contribution of EPS and P/E to Returns The performance gap could widen further, as the top 5 largest stocks in the S&P 500 are superior on almost every financial metric (revenue, profit growth, margin structure, volatility and corporate leverage). Image: Credit Suisse Research
S&P 500, U.S. 10-Year Bond and 60/40 Portfolio – Cumulative Total Return Since 1900 Is market timing a good idea? Image: Goldman Sachs Global Investment Research
S&P 500 Excluding Five Highest and Lowest Return Days As the chart suggests, mistiming the U.S. stock market can be disastrous. Image: Goldman Sachs Global Investment Research
Seasonality – Average Monthly Total Return for the S&P 500 Index and Statistical Significance Over the past 20 years, July has been positive on average with a high confidence level. Image: Morgan Stanley Research
Seasonality – S&P 500 60-Day Rolling Forward Return On average, July 31 marks the start of the worst 60-day stretch for the S&P 500 since 1990. Image: Morgan Stanley Research
S&P 500 Cash Return Payout Ratios (% of Net Income) S&P 500 payout ratio is in secular decline, as S&P 500 companies shift to buybacks. Image: Goldman Sachs Global Investment Research
S&P 500 Trailing 10-Year Total Return vs. Forward 10-Year Returns Historically, forward 10-year S&P 500 returns are not correlated with trailing 10-year returns. Image: Goldman Sachs Global Investment Research
Performance – S&P 500 Tech vs. S&P 500 Banks Total Return Relative Tech stocks have weathered the coronavirus panic. The outperformance of tech vs. banks is the biggest since the dotcom bubble and the Global Financial Crisis. Image: BofA Global Investment Strategy
Volatility – VIX Level and S&P 500 67-Day Return The speed of the rally could partly explain why the VIX remains high. Image: Goldman Sachs Global Investment Research