S&P 500 YTD Returns by Credit Rating
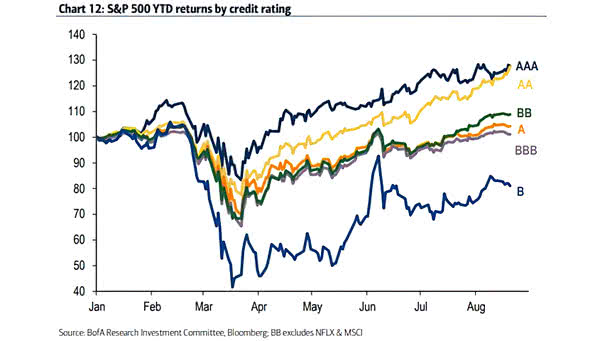
S&P 500 YTD Returns by Credit Rating Chart showing the impact of credit ratings on stock returns since the beginning of the year. Image: BofA Research Investment Committee
S&P 500 YTD Returns by Credit Rating Chart showing the impact of credit ratings on stock returns since the beginning of the year. Image: BofA Research Investment Committee
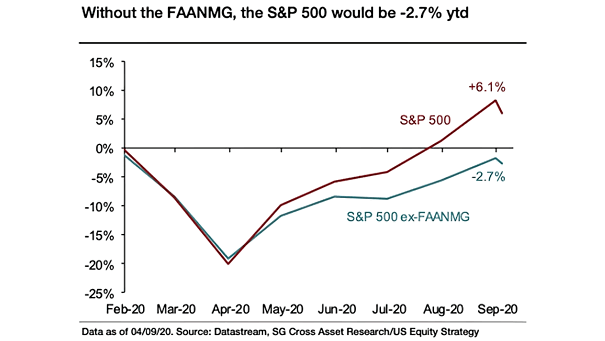
Returns – S&P 500 vs. S&P ex-FAANMG FAANMG stocks are driving the S&P 500 higher year-to-date. Image: Societe Generale Cross Asset Research

Returns – Growth and Defensive Sectors vs. S&P 500 ex-Growth and Defensive Sectors Growth and defensive sectors are driving the S&P 500 higher YTD. Image: Societe Generale Cross Asset Research
S&P 500 Total Return – Bear Market Bottoms This chart shows bear markets over the past 100 years. Is a new bull market cycle underway? Image: Fidelity Investments
Returns – S&P 500 Is on Pace for Its Fifth Consecutive Month of Gains Does the U.S. stock market rally have more legs, even though valuations are high? Image: Bloomberg
S&P 500 Total Return / S&P 500 Equally Weighted Total Return Will the S&P 500 continue to outperform its equally weighted equivalent? Image: Deutsche Bank
Performance – Return from the S&P 500’s Prior High on Feb. 19 to the New All-Time High Despite the S&P 500 new all-time high, a majority of S&P 500 stocks are down significantly from where they were in February. Image: CNBC
S&P 500 Index Returns Final 5 Months of Year When the S&P 500 is up in April, May, June, and July, as it is this year, it tends to be bullish. Image: LPL Research
S&P 500 Total Return Attribution Multiple expansion explains the S&P 500’s total return YTD, despite negative earnings growth. Image: The Daily Shot
Seasonality – Median S&P 500 2-Month Returns since 1985 Since 1985, August and September have been the two worst months of the year for the S&P 500. Image: Goldman Sachs Global Investment Research
Top 5 vs. S&P 500 ex-Top 5 – YoY Contribution of EPS and P/E to Returns The performance gap could widen further, as the top 5 largest stocks in the S&P 500 are superior on almost every financial metric (revenue, profit growth, margin structure, volatility and corporate leverage). Image: Credit Suisse Research