Performance – S&P 500 Tech vs. S&P 500 Banks Total Return Relative
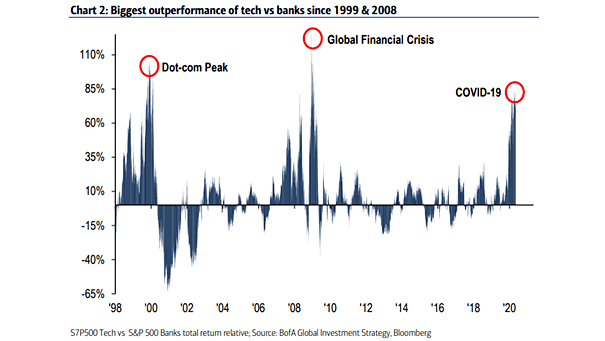
Performance – S&P 500 Tech vs. S&P 500 Banks Total Return Relative Tech stocks have weathered the coronavirus panic. The outperformance of tech vs. banks is the biggest since the dotcom bubble and the Global Financial Crisis. Image: BofA Global Investment Strategy