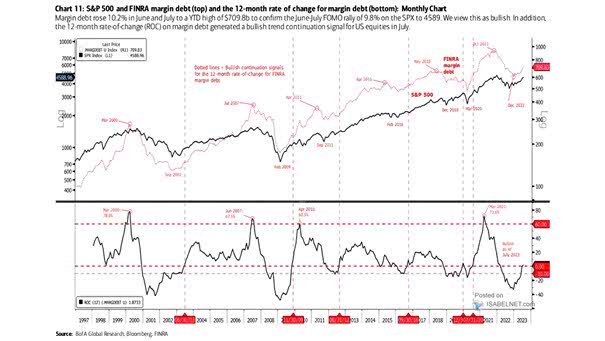
S&P 500 and 12-Month Rate of Change in Margin Debt
S&P 500 and 12-Month Rate of Change in Margin Debt The rise in margin debt in June and July can be seen as a bullish signal for U.S. equities, indicating increased optimism and risk appetite among investors. Image: BofA Global Research Click the Image to Enlarge