Dow Jones Industrial Average and 1918 Pandemic Flu
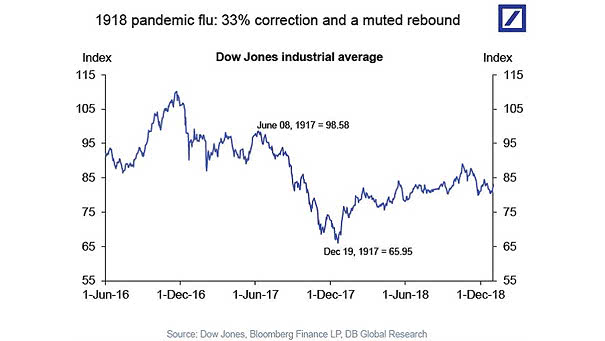
Dow Jones Industrial Average and 1918 Pandemic Flu During the influenza pandemic of 1918, the Dow Jones fell 33% and the rebound was muted. Image: Deutsche Bank Global Research
Dow Jones Industrial Average and 1918 Pandemic Flu During the influenza pandemic of 1918, the Dow Jones fell 33% and the rebound was muted. Image: Deutsche Bank Global Research
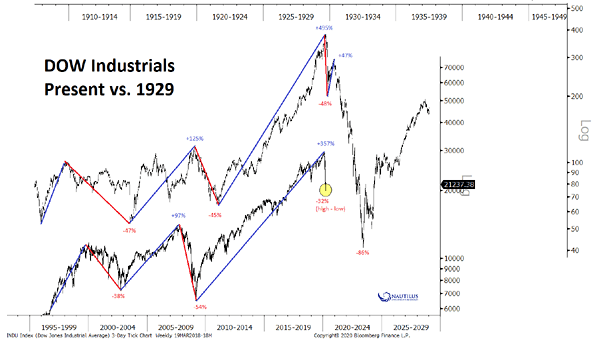
Dow Jones Industrial Average – Present vs. 1929 This chart compares the Dow Jones Industrial Average to 1929 (for informational purposes only). Image: Nautilus Research

Dow Jones Industrial Average’s 10 Largest One-Day Percentage Drops Yesterday was one the biggest Dow Jones losses of all time. Image: CNBC
Technology Relative to Energy and Industrials Tech companies dominate the global market as never before since the internet bubble. Image: Financial Times
Global Industrial Cycle and Copper vs. Equities Chart suggesting that copper should outperform equities in a global industrial rebound. Image: Oxford Economics
Consumer, Housing & Retail, Imports-Exports and Industrial Chart suggesting that consumer strength should pull the industrial economy upwards. Image: Arbor Research & Trading LLC
Commercial and Industrial Loans of U.S. Banks as % of GDP vs. Deliquency Rate Is the end of the U.S. credit cycle near? The delinquency rate remains low, while U.S. business loans are close to previous highs. Image: Pavilion Global Markets
U.S. Commercial and Industrial Loans Outstanding Business loan growth is slowing down, despite Fed easing. Currently, liquidity is going into the financial markets, but not into the real economy. Image: Pictet Wealth Management
Business and Industrial Sentiment vs. U.S. GDP Chart suggesting that business and industrial surveys have not explained U.S. economic growth over the past decade (R² = 0). Image: Arbor Research & Trading LLC
China Real M1 Leads World Industrial Production Chart suggesting that China’s real M1 leads world industrial production by 6 months. Image: Nordea, Sebastian Dypbukt Källman
S&P 500 Industrials Index and U.S. Manufacturing Unit Labor Costs When U.S. labor costs rise, industrial profit margins are under pressure. Image: Quill Intelligence, LLC